Gold - this rally has legs to go higher, but the bigger picture is not bullish
Let’s start from looking at a structure of a rally that started in August 2018. It has been nicely following a classic five wave up fractal .
Gold - 120 min chart updated on 28 January 2019
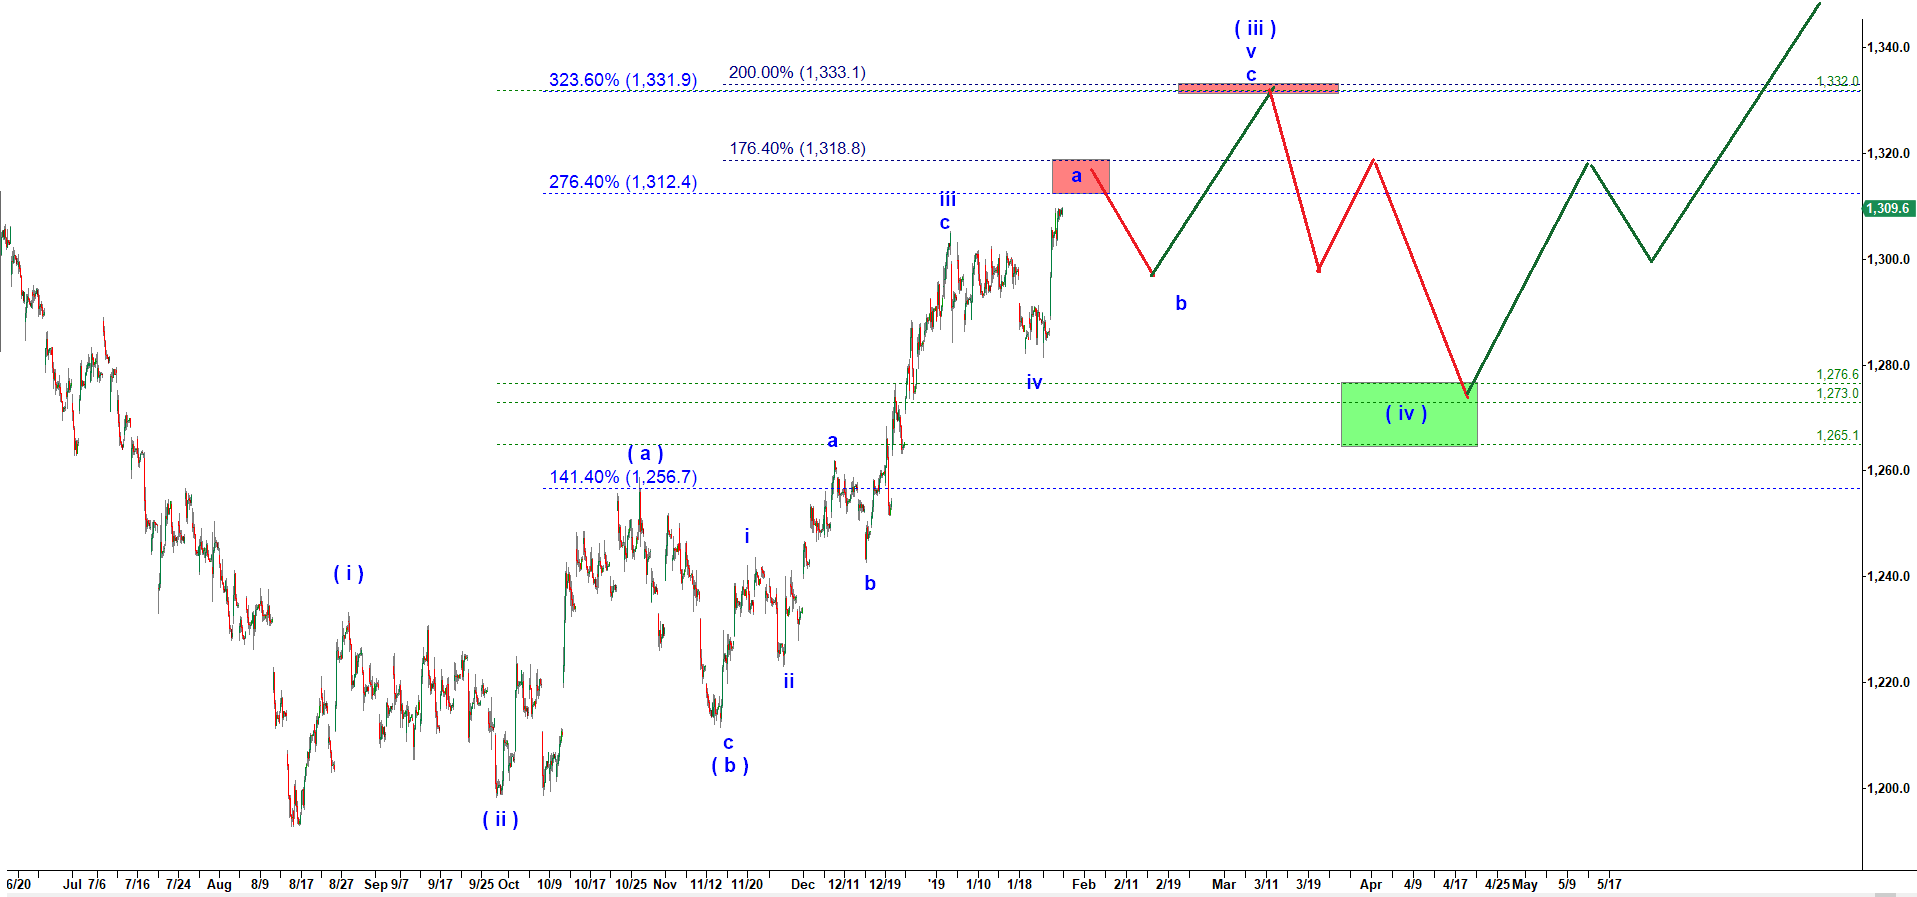
At this point we need a brief pullback in wave b of c of v of ( iii ) and then another rally targeting 1,330 to complete the most powerful part of the rally – its wave ( iii ) up. This part of the chart is no doubt gives bulls a strong encouragement. Now I want to show you why you should always zoom out to higher time frames to understand a bigger picture.
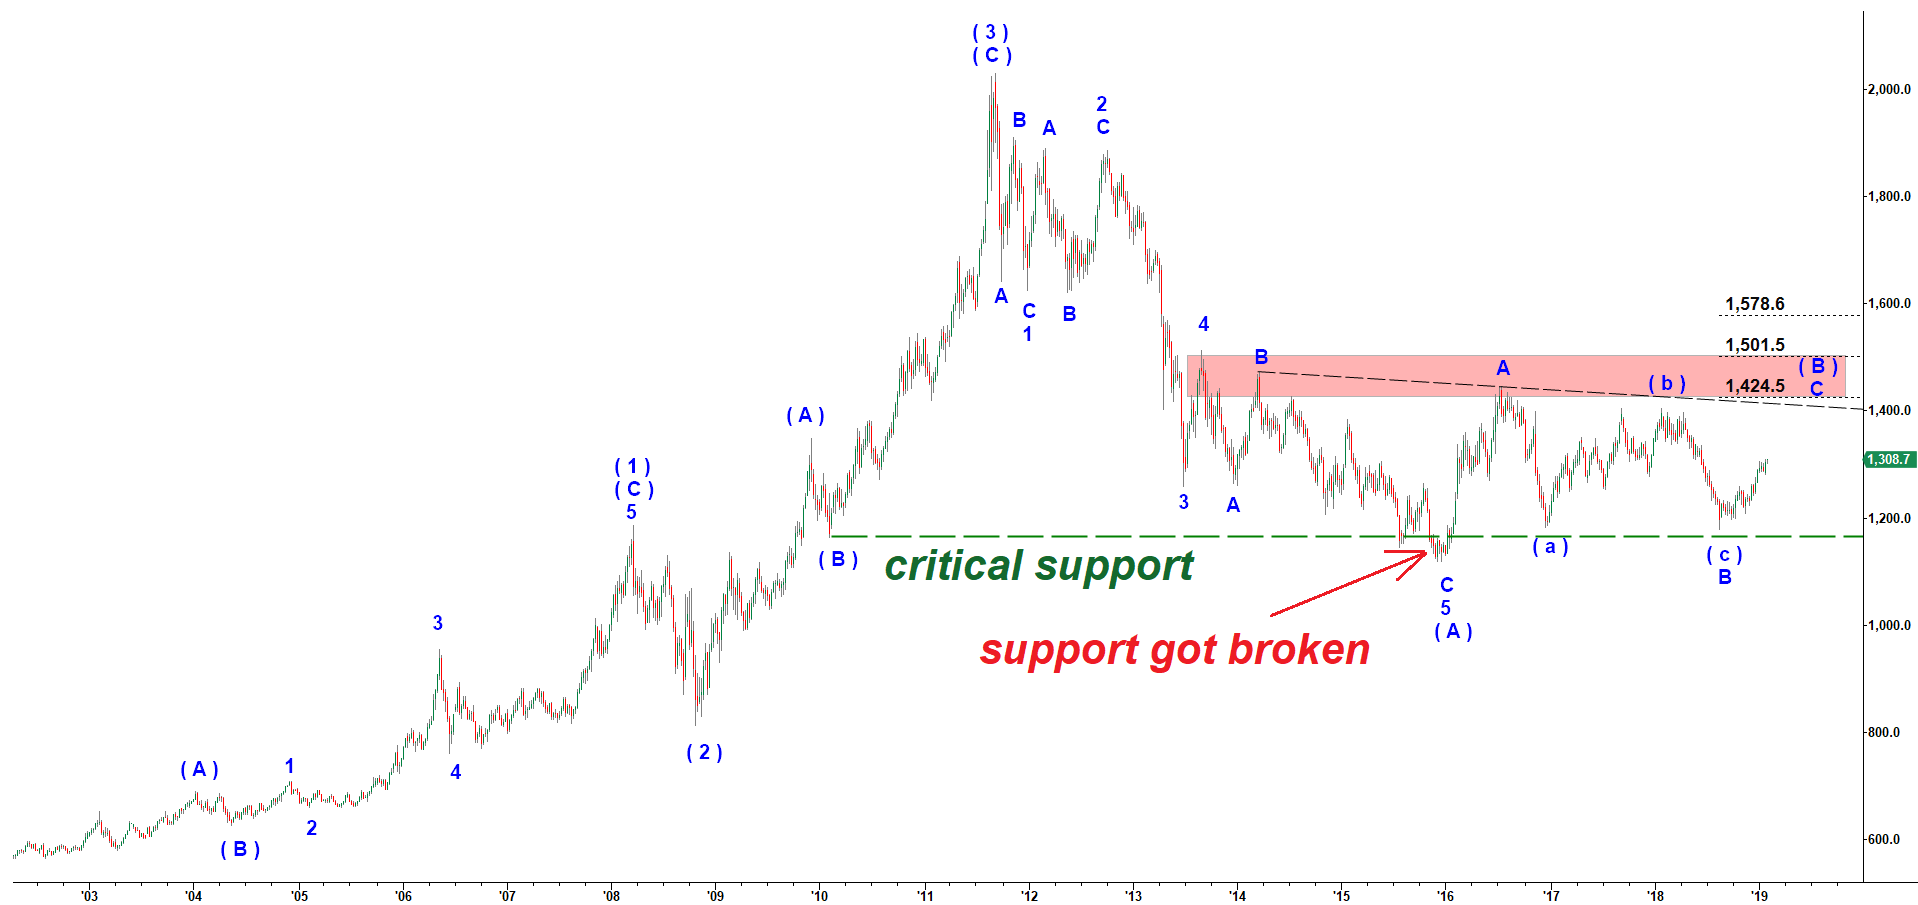
On the weekly chart below we can see that starting the low in 2001 price was rallying into the top of 2,029.70 reached in September 2011.
I count that top as the top of the wave ( 3 ) up. Off that top we are supposed to get a corrective wave ( 4 ) down. And that corrective wave ( 4 ) down has to hold over the low made be the previous corrective wave (B) of ( 3 ). That low was 1,163 made in February 2010. The huge problem of that bullish count that the corrective wave ( 4 ) violated that critical support dropping to 1,118 in December 2015. That violation of the critical support invalidated the bullish count. Moreover, you can see on the weekly chart below that the drop off the all time high had an impulsive structure. That means it was subdivided into five waves. Any corrective wave has to have a different A-B-C subdivision. That implies that the drop off the September 2011 top to the bottom in December 2015 was only the first leg of correction in the wave ( A ) down. That means that off the 2015 low we may get a corrective A-B-C move up.
Gold - weekly chart updated on 28 January 2019
The macro weekly count described above suggests that 2015 bottom was only a temporary low in the wave ( A ) down and off that low we should see a corrective wave ( B ) up.
Below I will introduce you two alternative paths that wave ( B ) up may choose from.
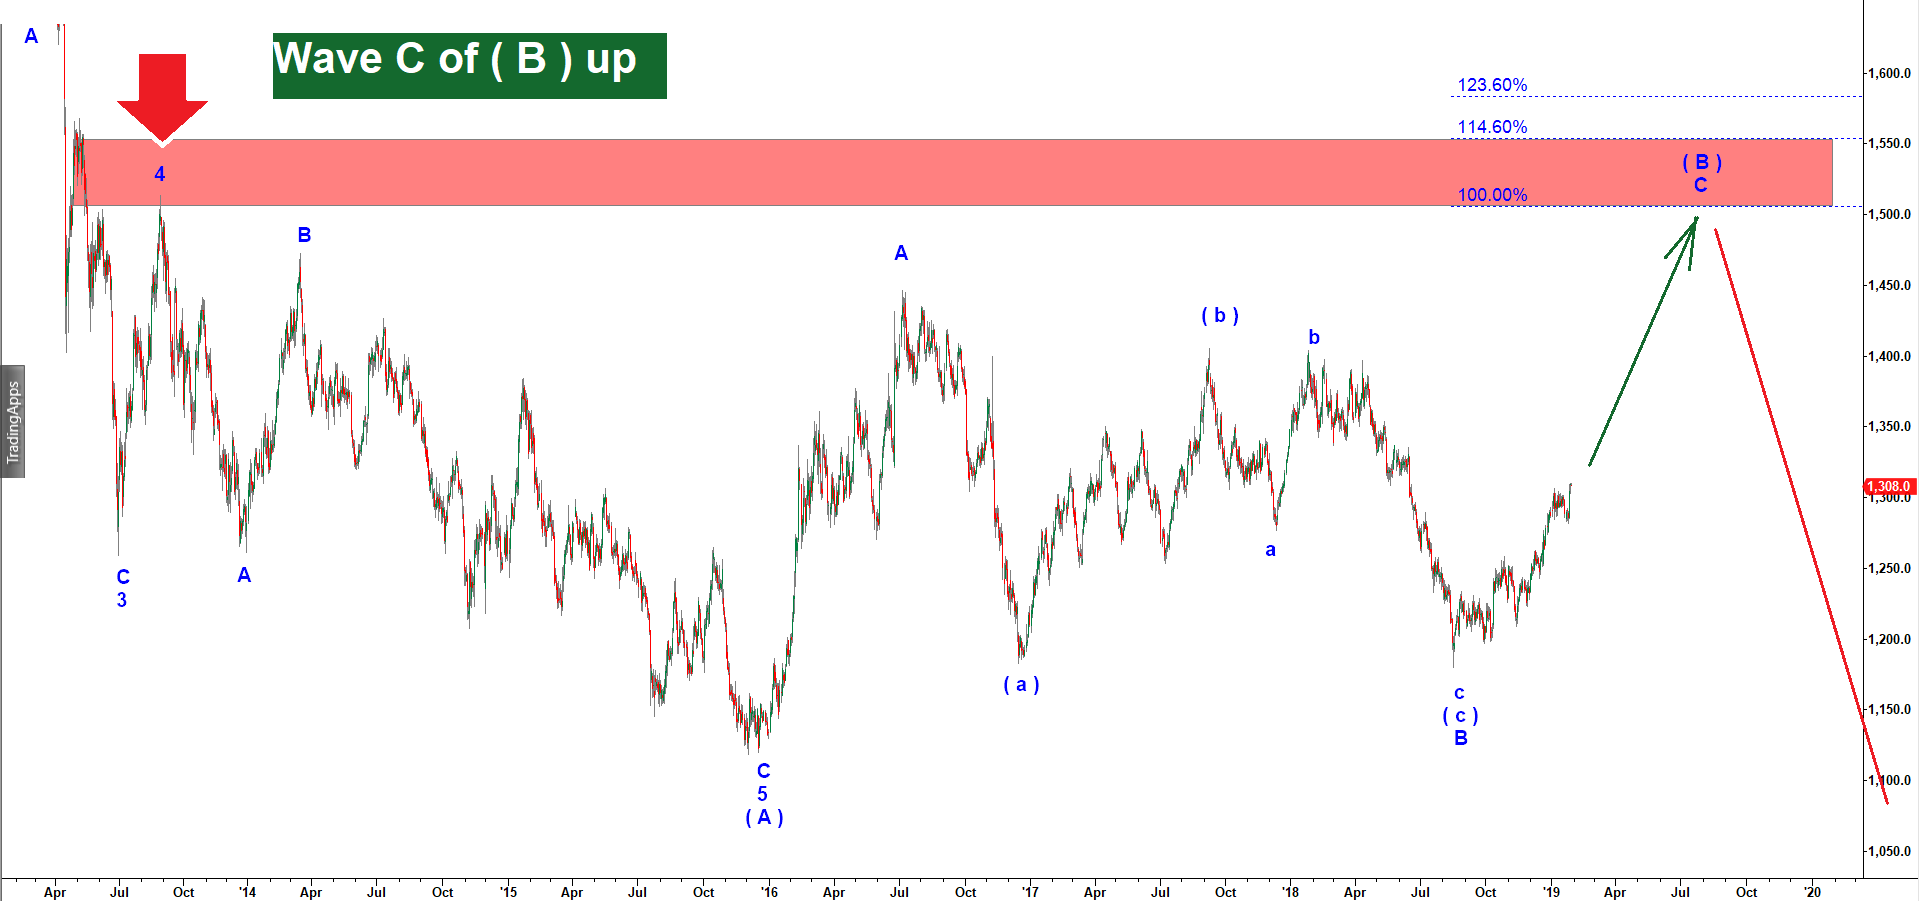
The first scenario is when wave ( B ) up is to be structured as a flat correction subdivided into A up, B down and C up. As you can see on the daily chart below, wave A of ( B ) topped at 1,446 in July 2016. Then we see a corrective (a)-(b)-(c) move down that bottomed at 1,179 in August 2018. I count that wave as B of ( B ). That count implies a rally in wave C of ( B ) off that August 2018 low. That rally should have an impulsive structure and subdivided into five waves of smaller degree. Now you can come back to the first 120 min chart above and see that the wave ( iii ) out of those five waves may top at 1,330.
So this count on the daily chart is in compliance with 120 min chart and the weekly chart discussed above. As soon as this wave (B) up finds its top in a neighborhood of 1,425 – 1,500 we may see another strong decline in wave ( C ) down that may target $800 or even lower.
Gold - daily chart updated on 28 January 2019
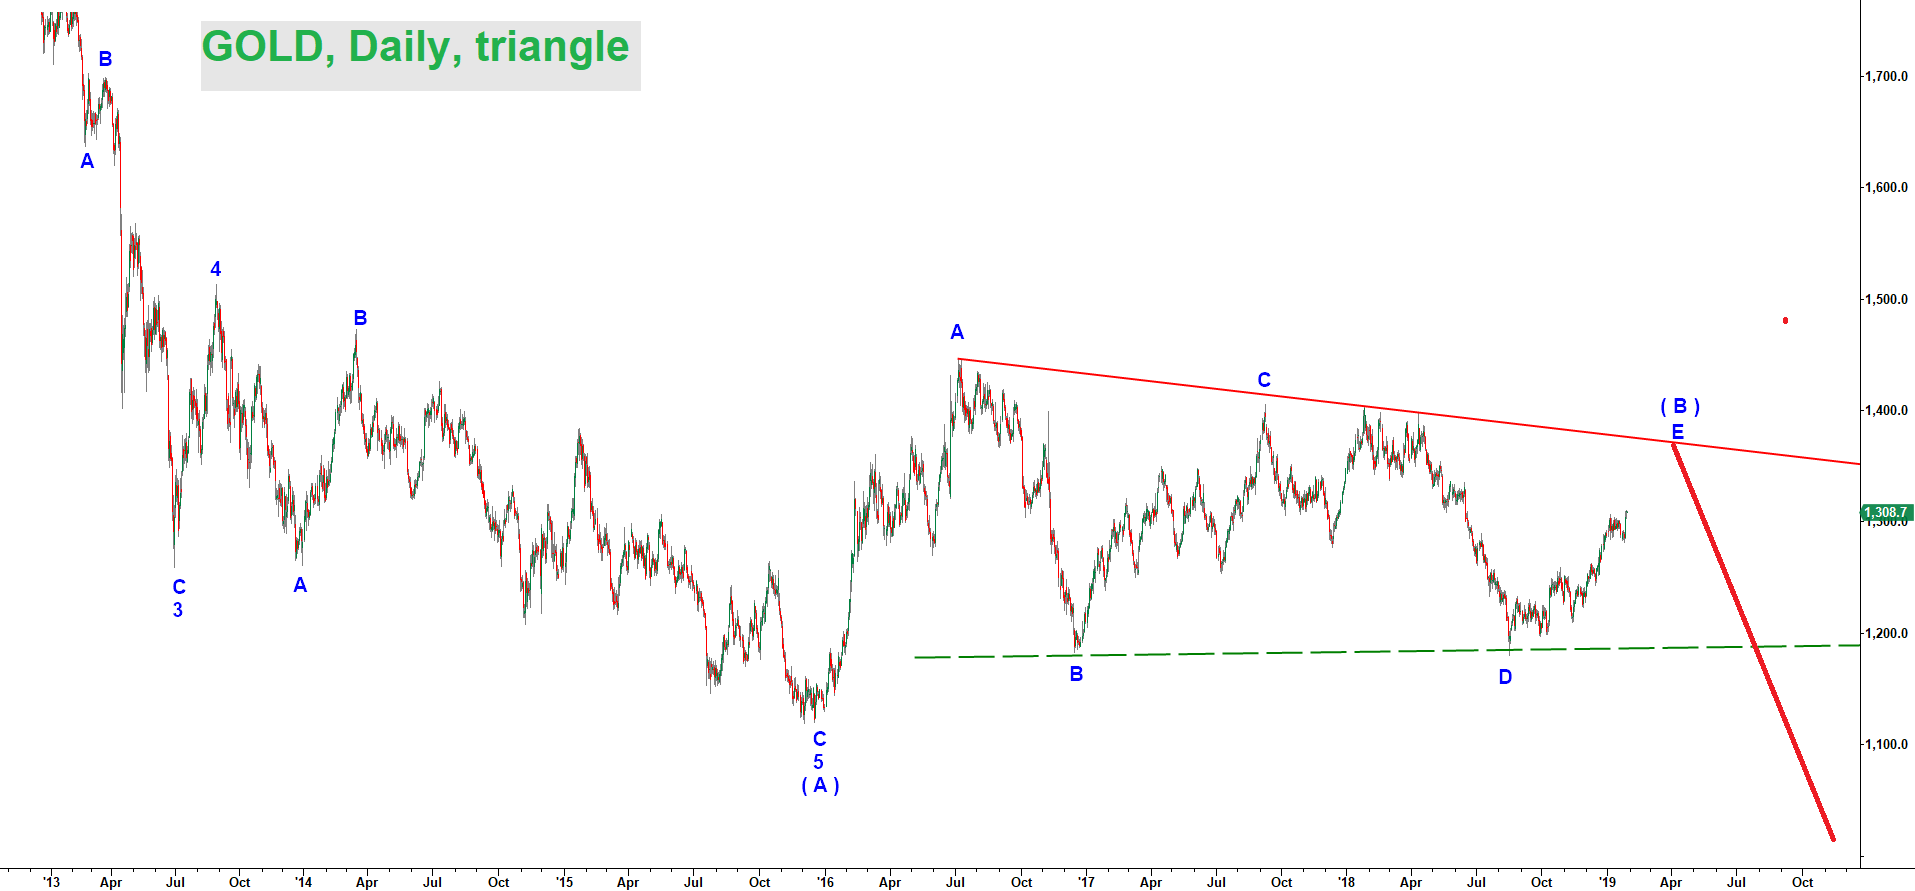
Finally, there is another slightly different scenario. It has the same starting point at the low reached in December 2015. And it also considers the drop off the September 2011 top as the first leg down in the wave ( A ) down and counts the move up off that 2015 low as a corrective wave ( B ) up. The difference is that it considers that wave ( B ) up to be shaped as a triangle instead of a flat A-B-C correction.
Any corrective wave shaped as a triangle is subdivided into five subwaves A-B-C-D-E. And in case of a contracting triangle each successive wave is shorter than the preceding wave. Under this scenario we are in the final subwave of the corrective wave ( B ) up. That rally may stop at 1,355 – 1,375. And once that wave ( B ) tops out we should get another strong decline well under $1,000.
In conclusion, we deal with a nice bullish structure on 2 hour chart which still points to one more rally at least to 1,330 in wave ( iii ) up. But the macro count is bearish and does not promise any major rally that would be able to break through 1,500 resistance.