Subscription: Micro Counts of Crude Oil & Nat Gas
Crude - has turned lower as expected
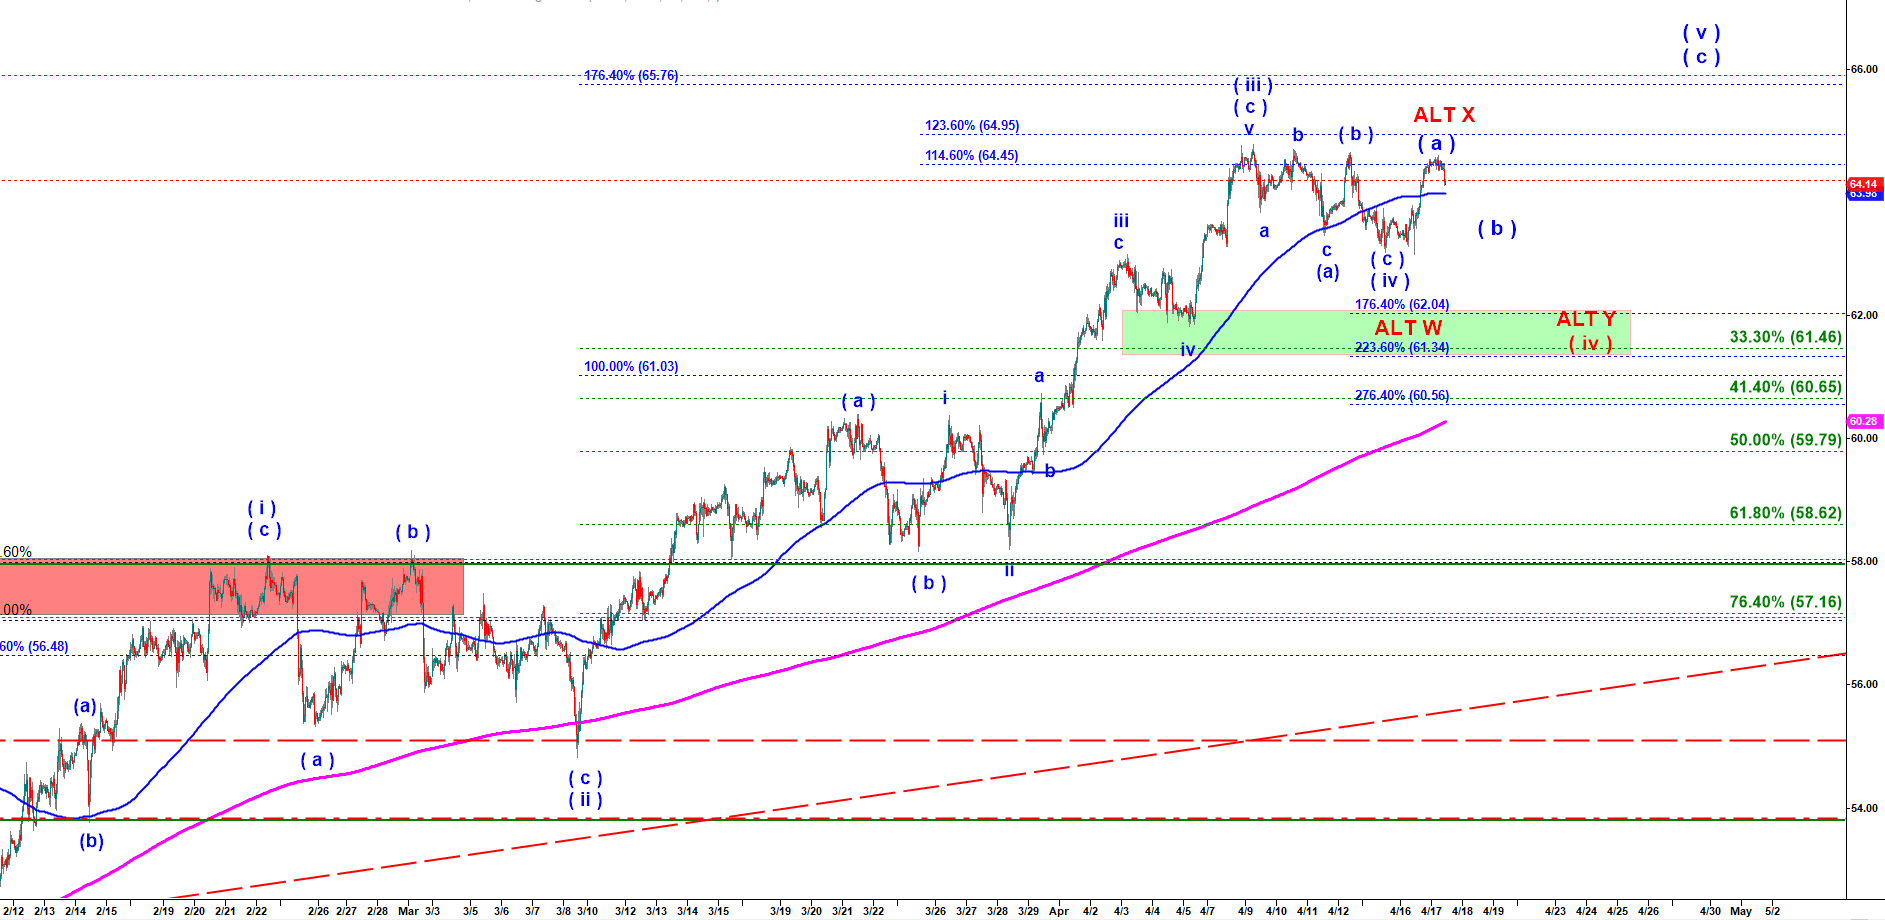
Crude has two scenarios here. The first scenario is that the previous pullback structured as (a)-(b)-(c) was a completed wave ( iv ) down ( the blue count). Then the retest of the top of the previous wave ( iii ) up is a textbook wave ( a ) of ( v ) that has to be followed by a pullback in ( b ) down. And aftre that we will get the final push higher in the wave ( c ) of ( v ) of C of ( B ) up completing a large rally started in December 2018.
The second scenario is that the previous pullback structured as (a)-(b)-(c) was NOT a completed wave ( iv ) down but rather first leg down in wave W (see the red ALT count). Then this retest of the previous top is a corrective wave X up. And from here we may get another (a)-(b)-(c) structure down that would complete a corrective wave (iv ) down structured as a complex double three structure.
Crude Oil - 45 min chart updated at 9:40 AM on 4/17/2019