Bitcoin - you could have made tonnes of money following my updates
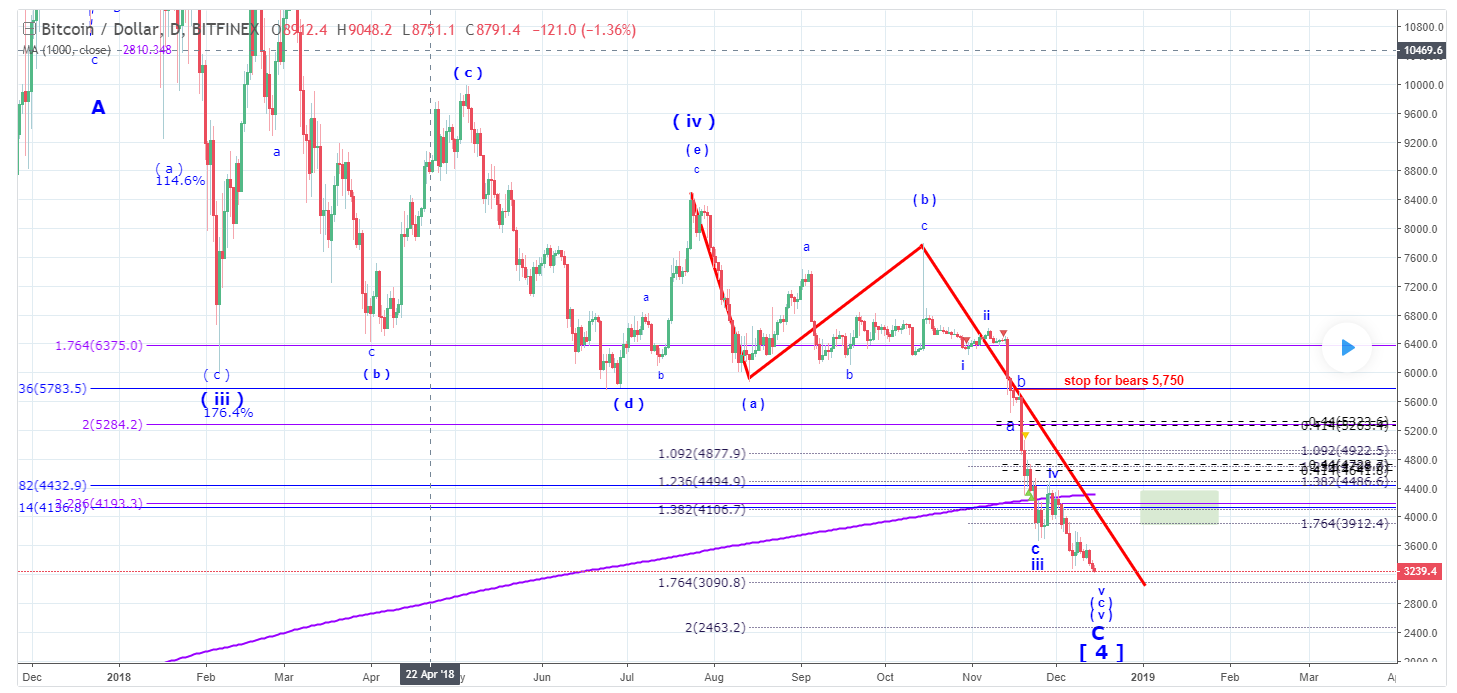
On 15 December 2018 I concluded that the large corrective move down off the top made in December 2017 was complete:
“…Together with a very completed micro five wave structure of the wave ( c ) of ( v ) that creates a high probability LONG setup. At the moment we witness an extreme bearishness about bitcoin. Yesterday I saw a headline “Bitcoin is dead”. By this moment the vast majority of bulls threw in the towel. That is a perfect condition for start of a rally”.
Bitcoin - daily chart updated on 15 December 2018
On 24 December 2018 I warned that the first leg up off the bottom is about to get completed:
“As expected, bitcoin has made one more high and got close to the first target of 4,500. It can stop here and start a corrective wave b down.”
Bitcoin - daily chart updated on 15 December 2018
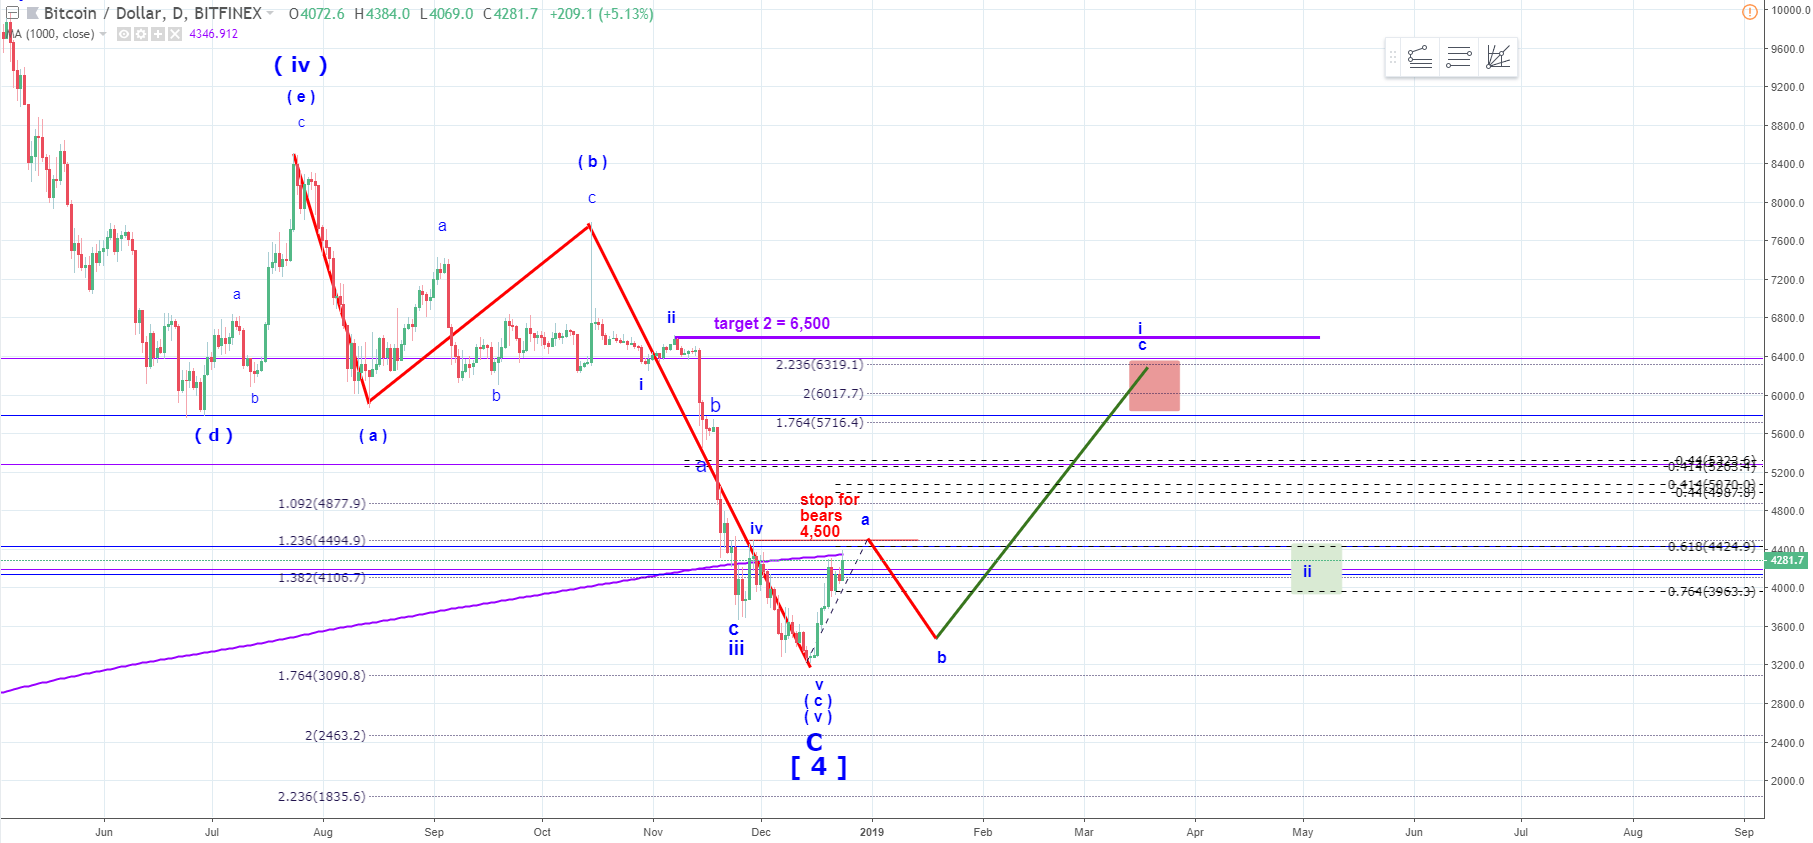
On 4 January 2019 I predicted a drop in a corrective wave ( b ) down followed by another strong rally in wave ( c ) up:
“And the best resolution here will be to see a drop to 3,400 – 3,300 to complete that corrective wave. And from there I would expect another stronger rally in wave c of i up.”
Bitcoin - daily chart updated on 4 January 2019
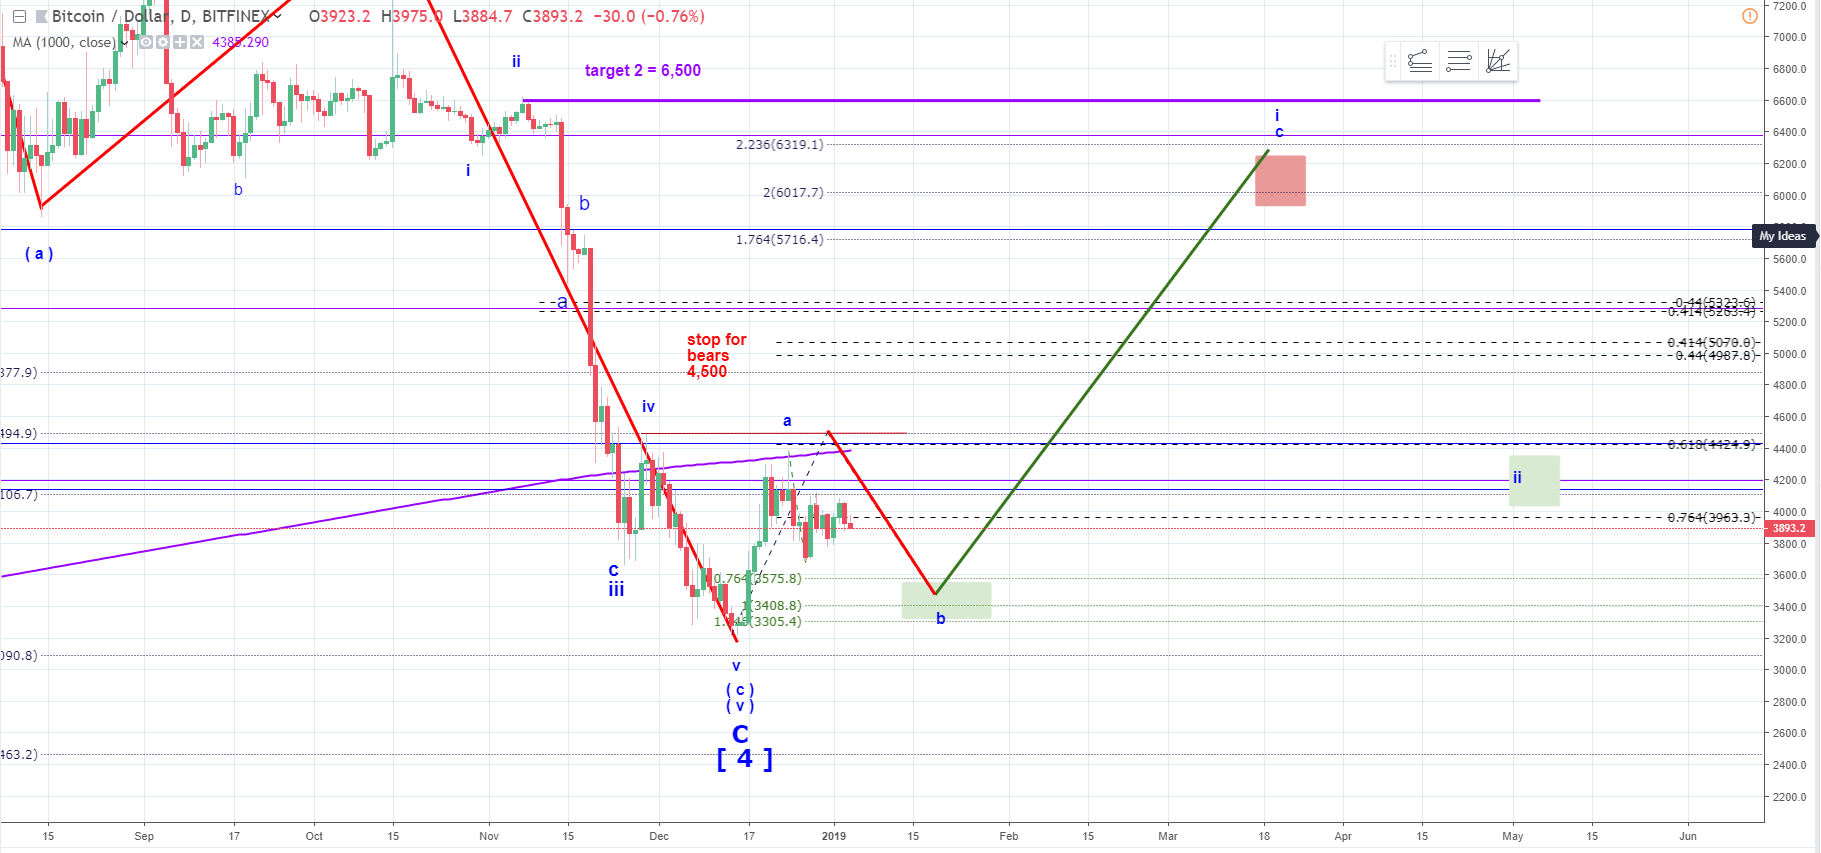
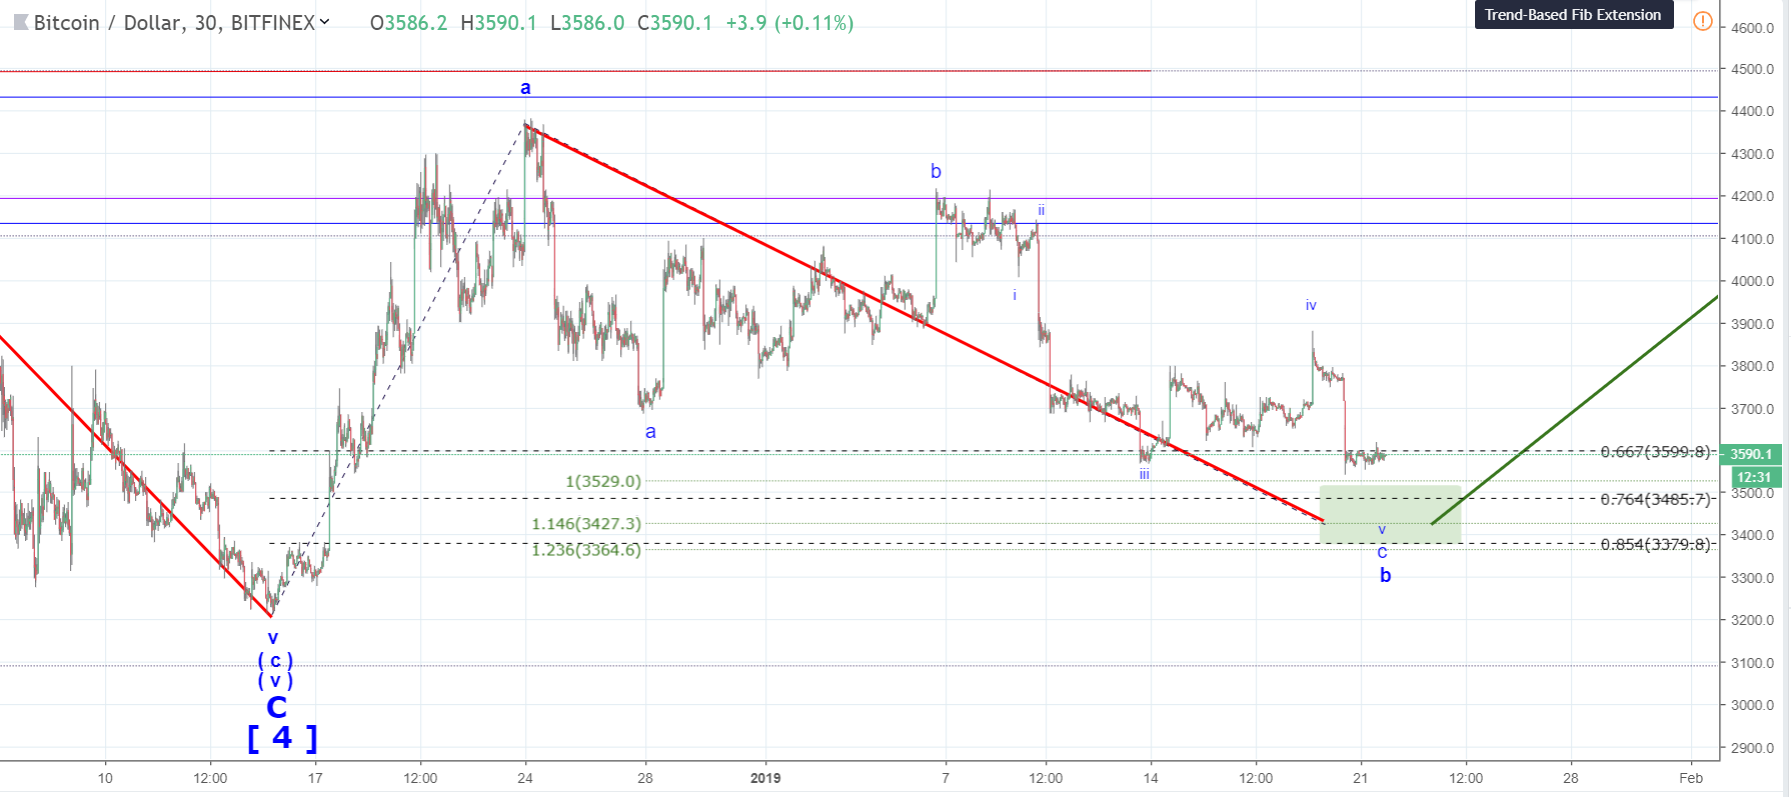
On 21 January 2019 I tried to calm down frightened bulls and reassured my expectation about upcoming rally:
“Your main question now is whether that drop changes my expectations about a rally to 5,000. And the answer is no, it does not. That last a-b-c move up off the low to the high of 3,714 should be counted as micro wave iv up and we are in the final micro wave v down that can get deeper into the green box to 3,385 or even deeper to 3,379 without damaging the bullish count.”
Bitcoin - daily chart updated on 21 January 2019
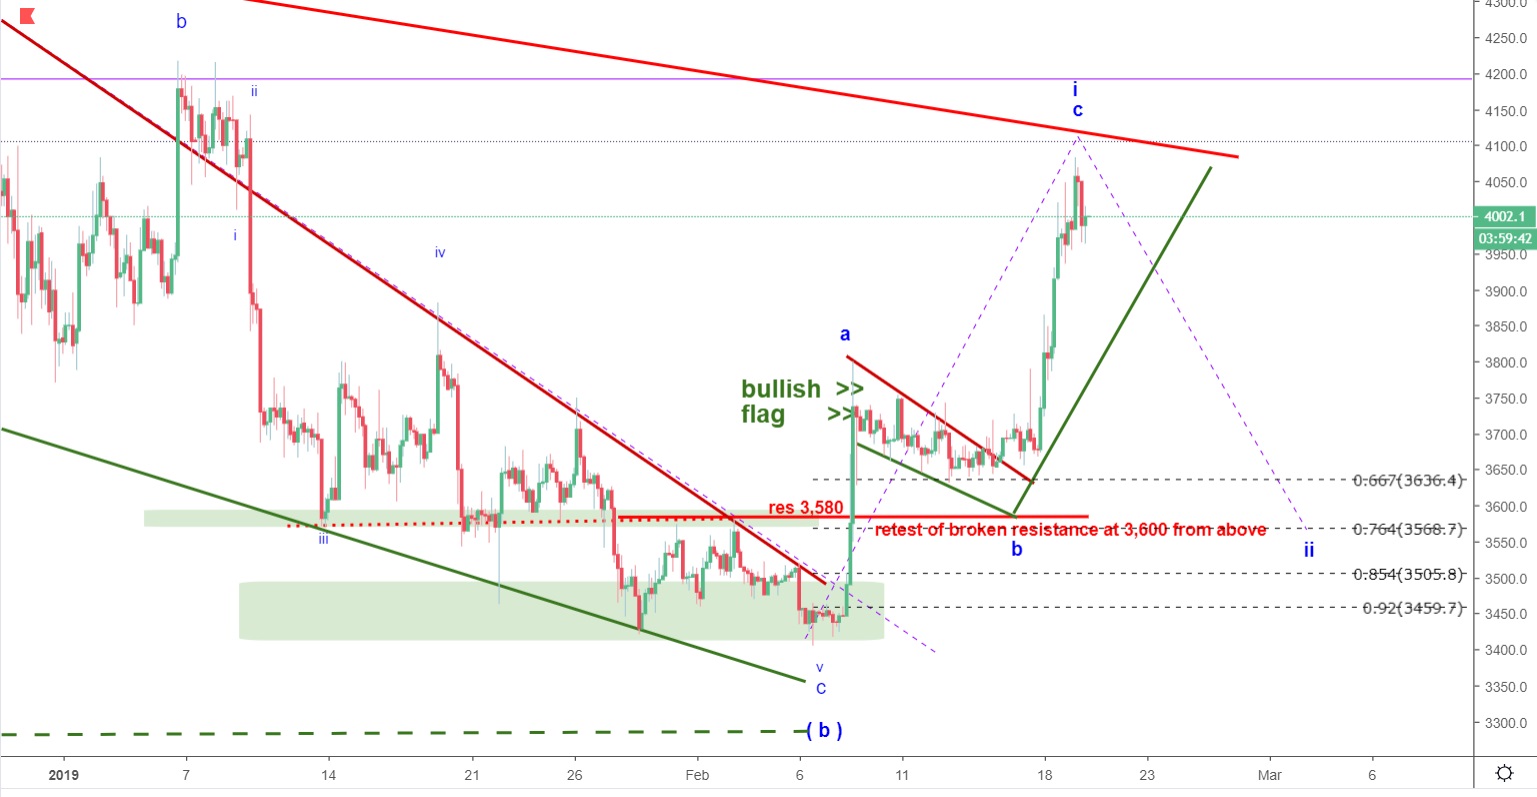
On February 2014 I predicted another leg of a rally targeting 4,000:
Bitcoin - daily chart updated on 14 February 2019
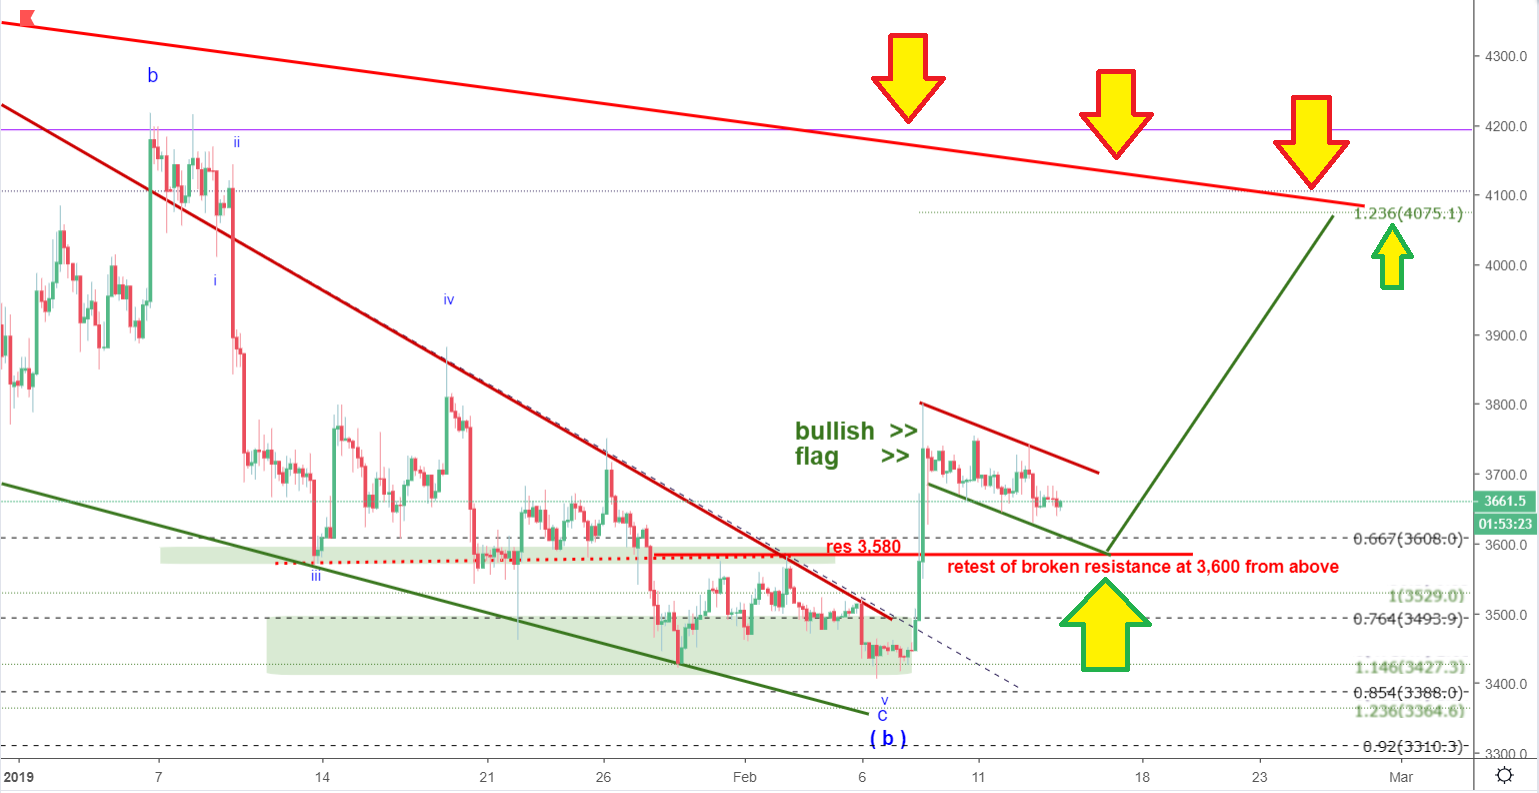
Today Bitcoin hit 4,080 which is 114.6% extension o the first leg up topped on 8 February 2019. I count that a-b-c move up off the low reached by a corrective wave ( b ) down on 6 February 2019 as wave i up of the wave ( c ) of ( i ) up. That wave ( c ) of ( i ) up should be subdivided into five waves of a smaller degree. Bitcoin has either completed or may make one more high at 4,120 to complete wave i up. Then we should get a corrective wave ii down. That pullback may be pretty deep targeting breakout point at 3,600. That is why I sold my position on Tuesday and will be waiting for a pullback to reload. That pullback may get 2 – 4 weeks. So stay tuned and be patient.
I do not know about you but even myself is pretty much impressed with accuracy of my calls on Bitcoin for the last several months. If you have followed me you know I am not a person who brags about profits. I put together those old charts to show you why I am thoroughly convinced that Harmonic Elliott Wave is the most efficient tool for trader nowadays. What makes its special is not only its efficiency but also simplicity. Personally I have never seen any analyst who could predict every major turn over the span of several months. And that does not mean that I am special. That speaks for the efficiency of the technique I use…
If you start learning that method today you most likely will not be able to make such accurate predictions in two or three months. But if you keep learning and practicing it you will see major improvements in your trading results in 5 – 6 months. I can only say that I wish I found that method and somebody who could teach it in plain English ten years ago…
Bitcoin - daily chart updated on 19 February 2019