• Home
  • US Market Updates
  • Education
    • Beginners Video Course
    • Intermediate Video Course
      • Syllabus of the Course
    • Trading Like A Pro Video Course
    • Video Lesson of the Week
  • Blog
  • Chat Room
  • Pricing
  • FAQ
Menu
  • Home
  • US Market Updates
  • Education
    • Beginners Video Course
    • Intermediate Video Course
      • Syllabus of the Course
    • Trading Like A Pro Video Course
    • Video Lesson of the Week
  • Blog
  • Chat Room
  • Pricing
  • FAQ

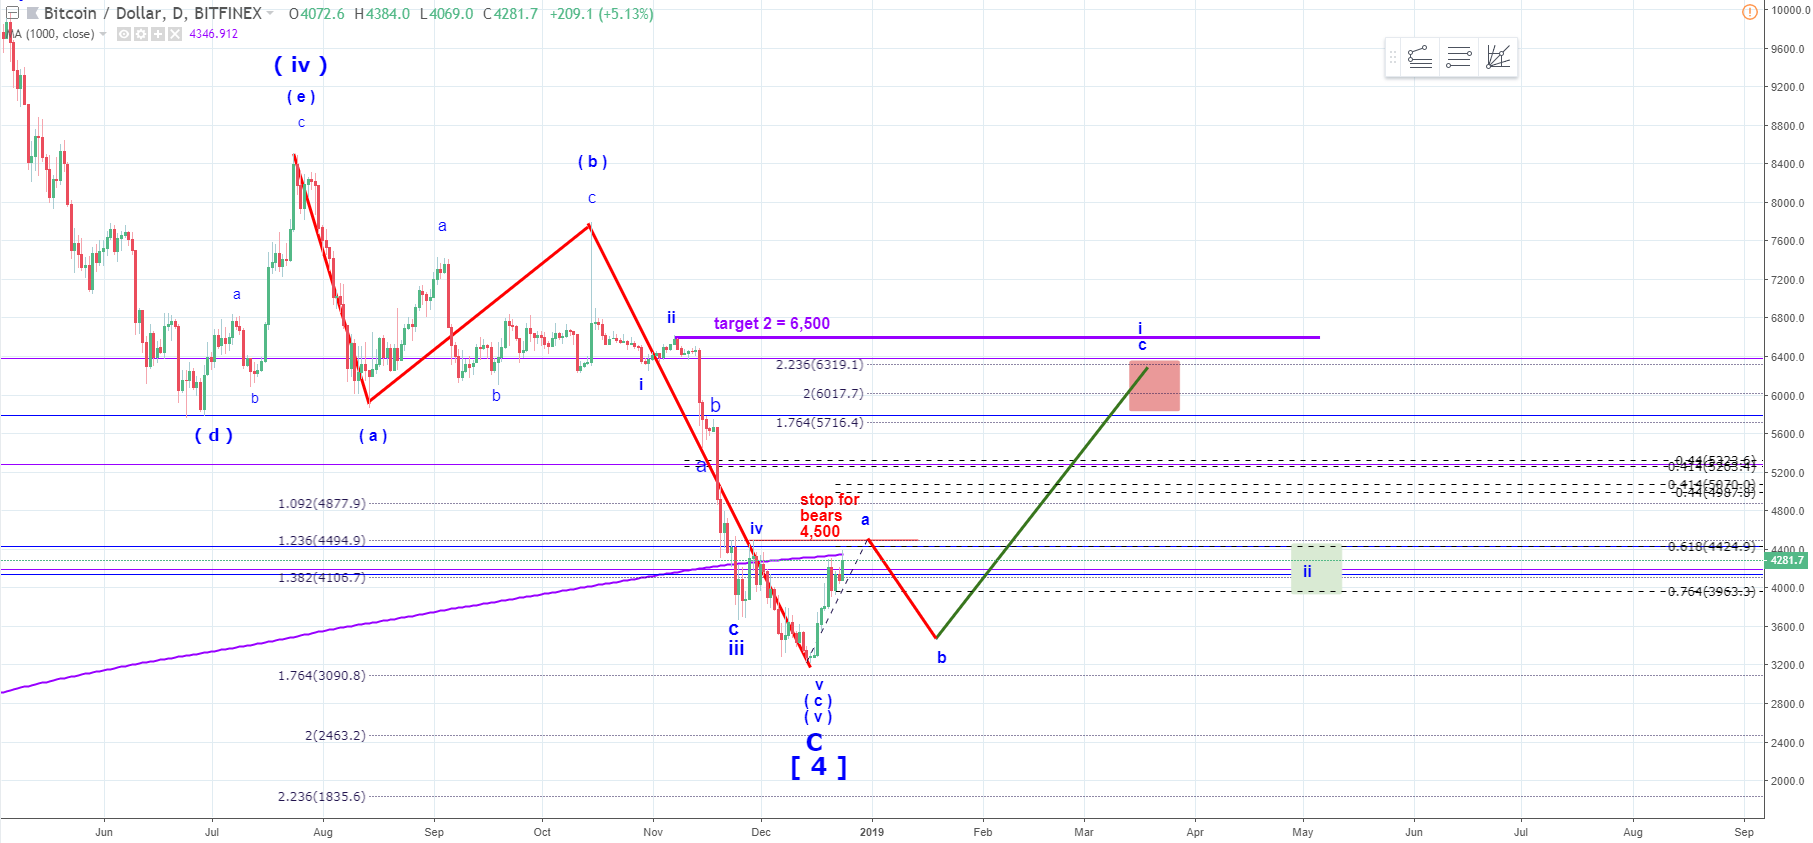
Bitcoin - approaching the first target of 4,500

As expected, bitcoin has made one more high and got close to the first target of 4,500.

It can stop here  and start a corrective wave b down. But it would be so much better if it could at least briefly violate a very strong and important resistance of 4,500.

Such a break even on a temporary basis  be a great sign that the bottom is in.

The ultimate goal for us is to wait a corrective wave b down to make a HIGHER LOW drawing an inverted head and shoulders formation.

That would be a great entry point for the coming rally in wave c off the low.

That rally may stretch to 6,500

BTCUSD - Daily chart updated on 24 December 2018

Start to learn how to predict the next market move today!
Get a promo-code for 40% discount valid until 31 Dec 2018
Tags
$ES $SPX a-b-c- up pullback a-b-c up Bearish reversal Bear Market Rally Bitcoin Bottoming Breakdown breakout Bullish Wedge Crude Oil Daily Double Three DXY ES Expanded Flat Expanding Triangle failed breakdown failed breakout Green Box Head and Shoulders i down - ii up setup Inverse Head and Shoulders i up - ii down setup Macro micro Month Opening Range NQ one more high one more higher high Red Box RTY Running Flat S&P short setup SPX topping toppying trading setup triangle Triple Three weekend Weekly YM
Read my Blog

  • My Account
  • Login
Hestia | Developed by ThemeIsle