• Home
  • US Market Updates
  • Education
    • Beginners Video Course
    • Intermediate Video Course
      • Syllabus of the Course
    • Trading Like A Pro Video Course
    • Video Lesson of the Week
  • Blog
  • Chat Room
  • Pricing
  • FAQ
Menu
  • Home
  • US Market Updates
  • Education
    • Beginners Video Course
    • Intermediate Video Course
      • Syllabus of the Course
    • Trading Like A Pro Video Course
    • Video Lesson of the Week
  • Blog
  • Chat Room
  • Pricing
  • FAQ

BTC - still expecting the final drop to $4,000

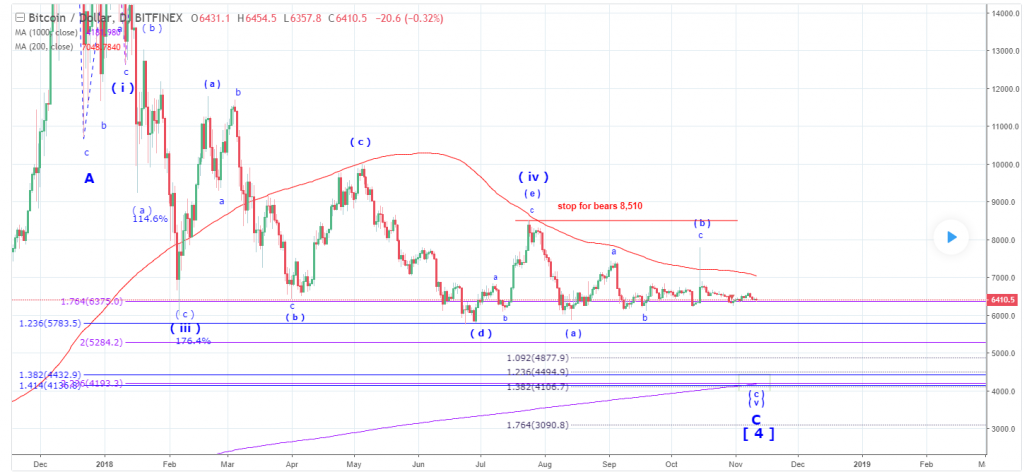
Bitcoin has been trading under 200 Daily Moving Average ( the red line ). 
At the same time a weekly 200 moving average currently stands at 4,000 ( the magenta line ). 
That level will be working as a magnet for the coming drop. 
That drop should set panic among retail investors making them dump their underwater holdings. According to my micro count it will complete the whole large corrective wave  [ 4 ] down started off the top of the wave [3 ] up at $19,796 reached in December 2017.

Bitcoin, Daily chart, updated on 11/11/2018

Tags
$ES $SPX a-b-c- up pullback a-b-c up Bearish reversal Bear Market Rally Bitcoin Bottoming Breakdown breakout Bullish Wedge corrective pullback Crude Oil Daily Double Three DXY ES Expanded Flat Expanding Triangle failed breakout Green Box Head and Shoulders i down - ii up setup Inverse Head and Shoulders i up - ii down setup Macro major bottom micro Month Opening Range NQ one more higher high Red Box RTY Running Flat S&P short setup SPX topping toppying trading setup triangle Triple Three weekend Weekly YM
Read my Blog

  • My Account
  • Login
Hestia | Developed by ThemeIsle