Bitcoin - corrective wave b down looks almost completed
On December 24th, 2018 I posted a warning that Bitcoin was approaching an important resistance around 4,500 and posted a chart where showed an expected drop in a corrective wave b down. Bitcoin topped at 4,391 and since then has been in a corrective looking decline following the path I expected back in December.
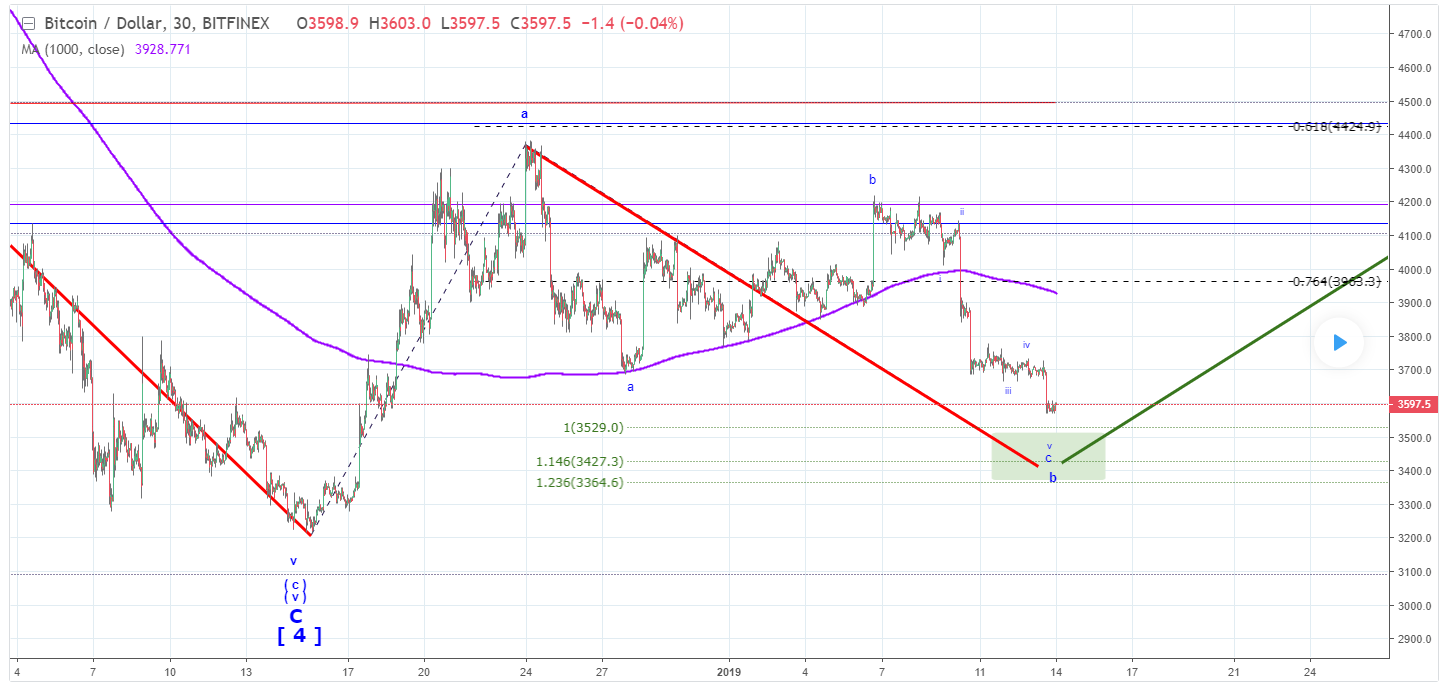
At this point the micro structure of that corrective wave b down looks almost completed. We may get one more push down to 3,520 where it could be a good time to buy.
Once that corrective wave b down finds its bottom I expect a new strong rally in wave c up that should target at least 4,990. But it may stretch all way up to 5,600 or even higher. That rally in wave c up would complete wave i up off the December low that I consider at this moment as the completion of the large correction started in December 2017.
Bitcoin - daily price chart updated on 13 January 2019