INDICATOR FOR TRADINGVIEW
TREND SYSTEM
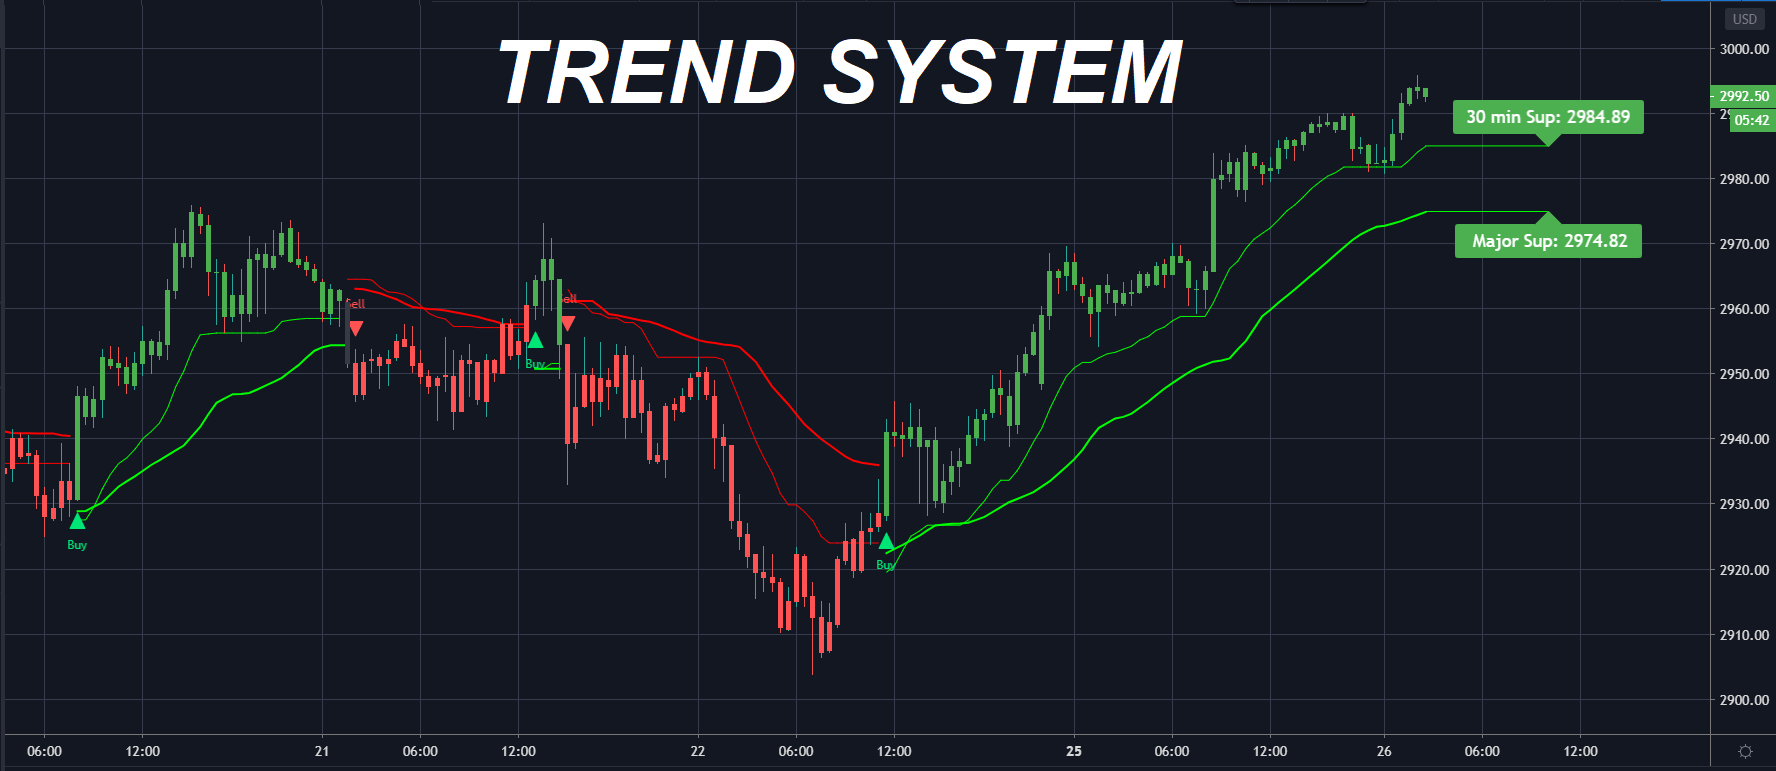
The indicator checks trend direction on multiple timeframes. It send you alerts when trend changes direction on two timeframes. It suggests you entries for reversal trades and trades on pullbacks in direction of the trend.
On the chart you see two trend lines:
- the thin trend line shows a minor support/resistance on the base timeframe (time frame of your chart in TradingView)
- the thick trend line shows a major support/resistance calculated on a higher timeframe
Floating text labels show exact current support/resistance on two timeframes:
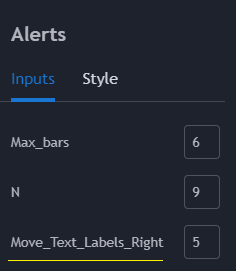
- You can change the way how those labels are drawn by changing input Move_Text_Labels_Right
"Buy" and "Sell" signals: change in direction of the trend
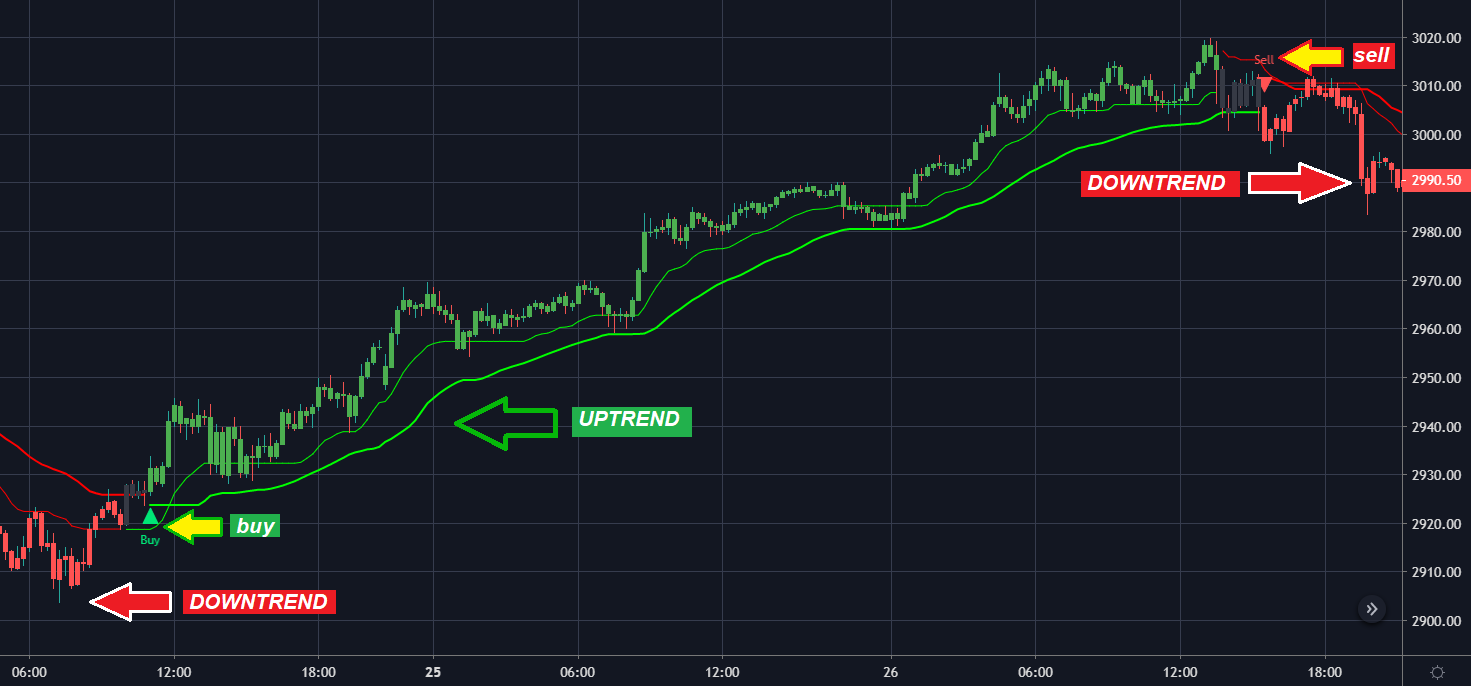
- When the price is trending down both on a base and higher time frames the indicator draws “Buy” or “Sell” signals and change colors of candles.
-
When the price is trending up on both, a base and higher time frames, the indicator colors candles in green color
-
When after a period when prices were trending down price breaks over a minor resistance (the thin red line ) and a bar closes over that minor resistance the trend switches from down (red color) to neutral ( grey color ).
-
When after a period when prices were trending up price breaks under a minor support (the thin line ) and a bar closes under that minor support the trend switches from up (green color) to neutral ( grey color )
-
When a new uptrend is detected signal “Buy” is drawn on the chart and Alert is generated
-
When a new downtrend is detected signal “Sell” is drawn on the chart and Alert is generated
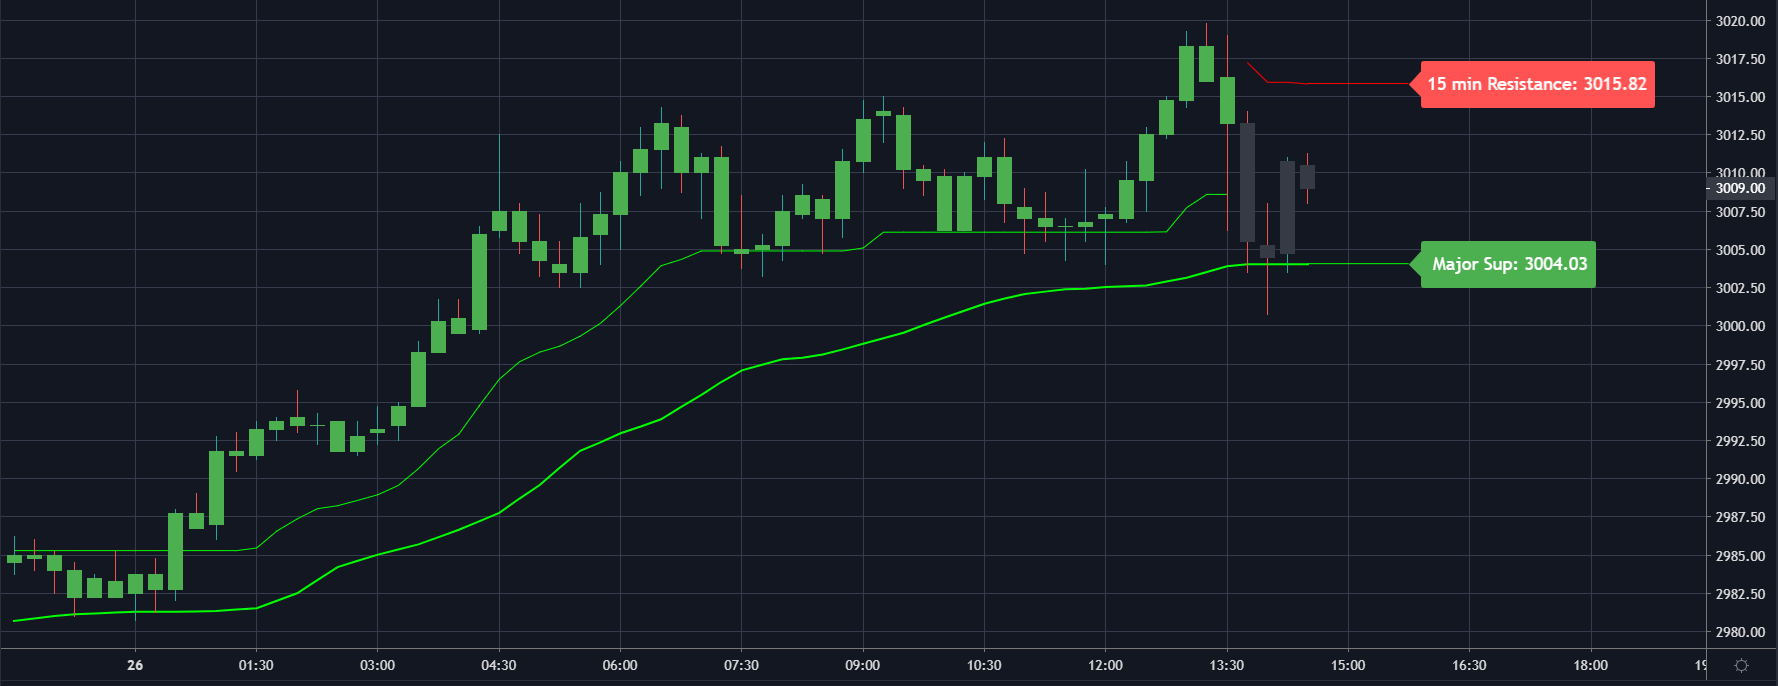
Trending up market: How to trade it
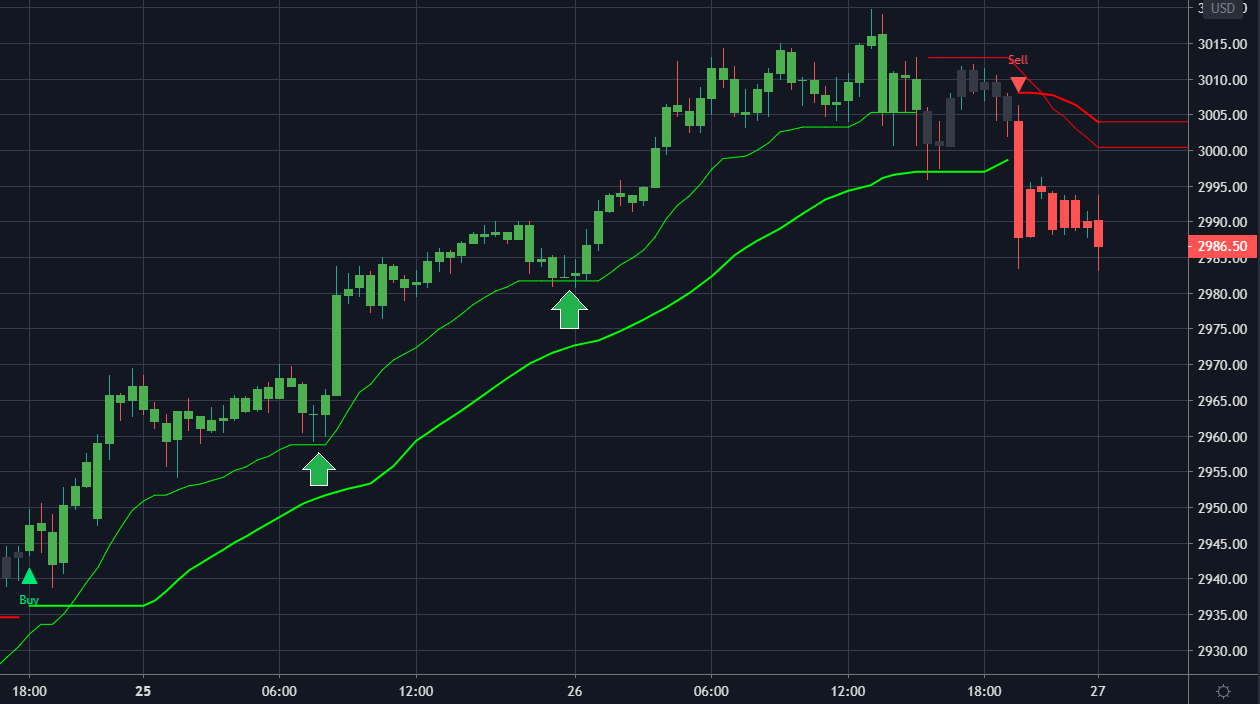
- when price moves higher in a strong trending move all pullbacks tend to get contained by the upper thin green support line.
- in a strong uptrend the minor thin support lines is always over the thick major support lines
- in majority of cases price drops to the minor support (the thin upper green line) and makes a doji candle or a candle with along tail testing the upper support
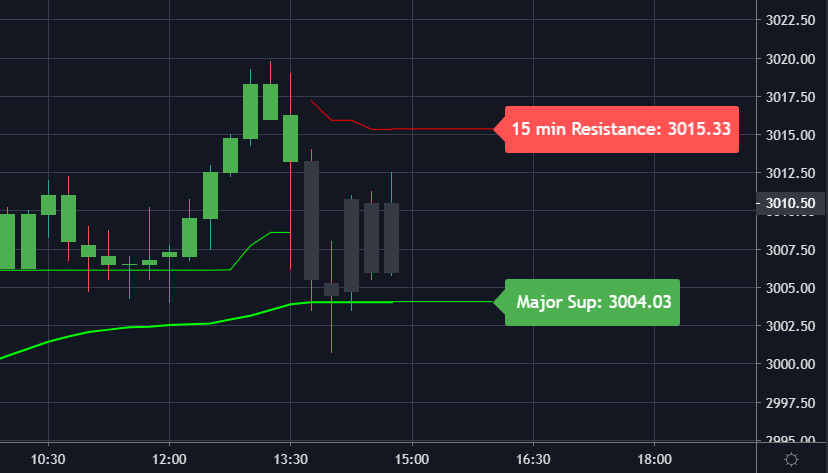
"Buy 2" signal: the indicator can catch those shallow pullbacks for you
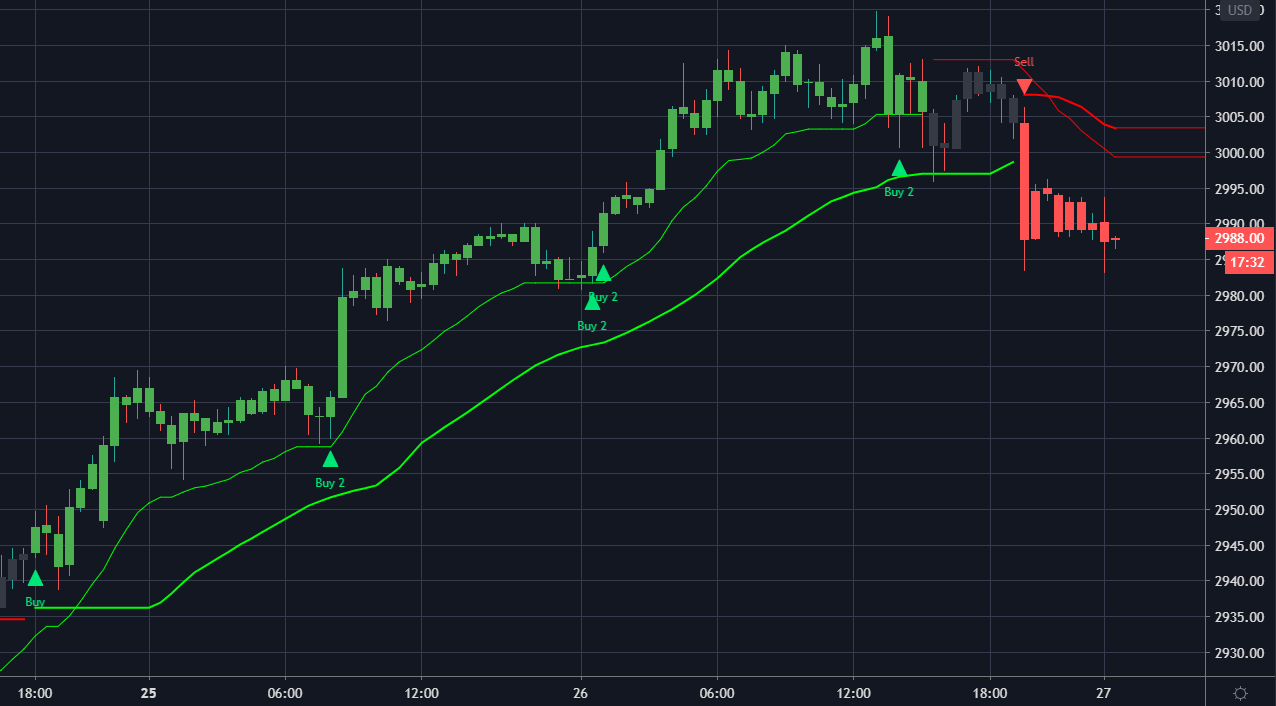
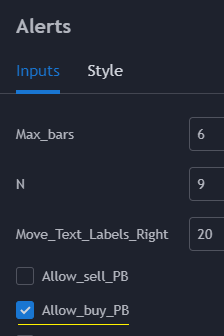
The indicator can highlight for you those shallow pullbacks that find support at the upper minor support (the upper green thin line). To make the indicator draw green “Buy 2” signs when shallow pullbacks hit upper support double click any line drawn by the indicator and you will see the input menu:
- Just double click the lines drawn by the indicator and you will see the input menu
- Click a check box Allow_buy_PB
- The indicator will start drawing green triangles Buy 2 and generate alerts when it detects minor pullbacks withing strong uptrends
Set email and pop-up alerts
- In order not to miss a signal produced by the indicator you can set up alerts. It will take you only ten seconds but you will have to follow that sequence of steps for each stock and each time frame.
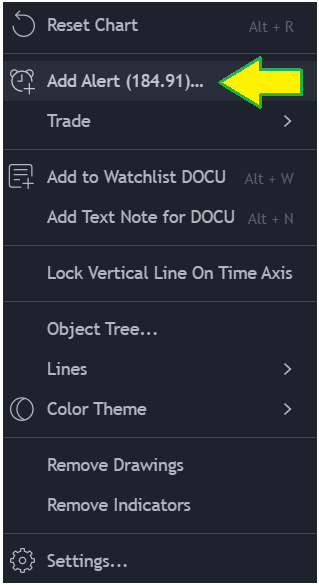
- Step 1. Open a chart of the stock you want to set alerts for. Make sure you have the desired timeframe on your chart. Right click any area of the chart and you will get a pop up menu. Click “Add Alert”.
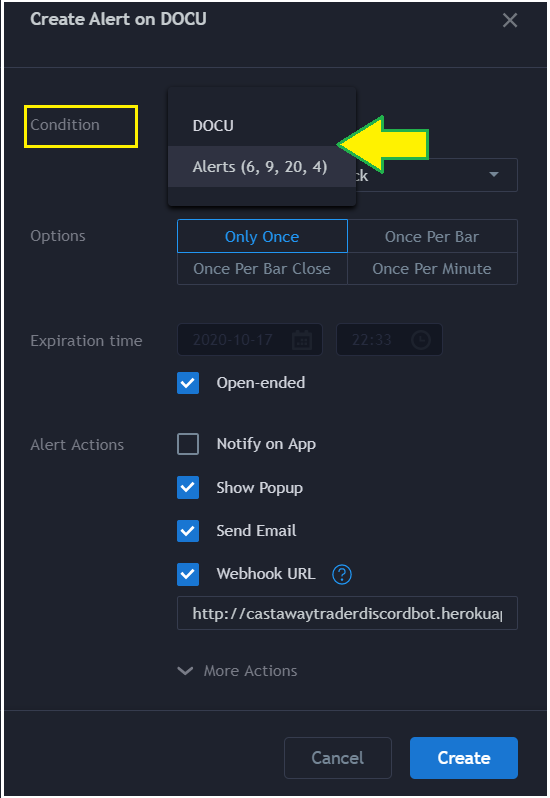
- Step 2. After you click “Add Alert (see the previous step) you will get a menu for alerts (see on the right).
- In that new menu click the very first window “Condition”, from the drop-down menu click the second line “Alerts(6,9,20,4)”
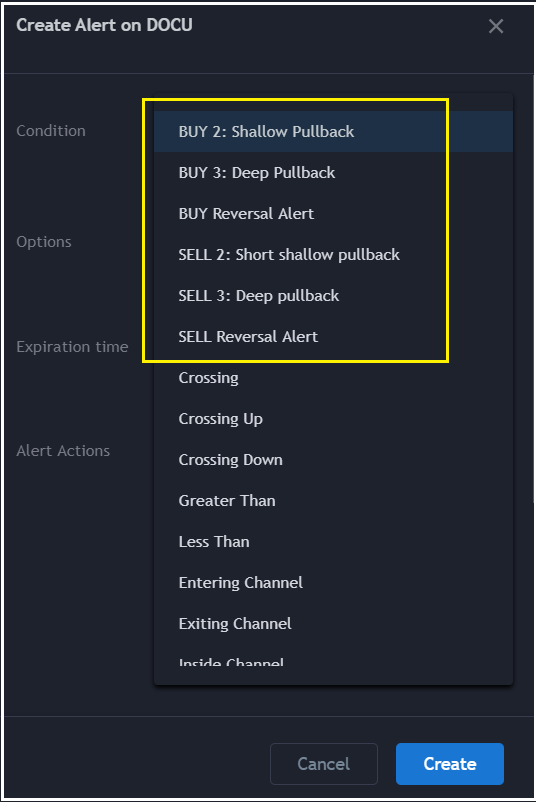
- Step 3. After you click “the second line “Alerts(6,9,20,4)” (see the previous step above) you will get a menu for specific alerts to choose from (see on the right).
- for each type of signal you will need to set its own alert
- “Buy Reversal Alert” – trend direction changes on two timeframes – indicated by signal “Buy” on the chart
- “Buy 2: Shallow Pullback” – indicator finds a shallow pullback when price test the upper support (the upper thin green line) – indicated by signal “Buy 2” on the chart
- “Buy 3: Deep Pullback” – indicator finds a deep pullback when price drops through the minor support and tests the major support (the lower thick green line) – indicated by signal “Buy 3” on the chart
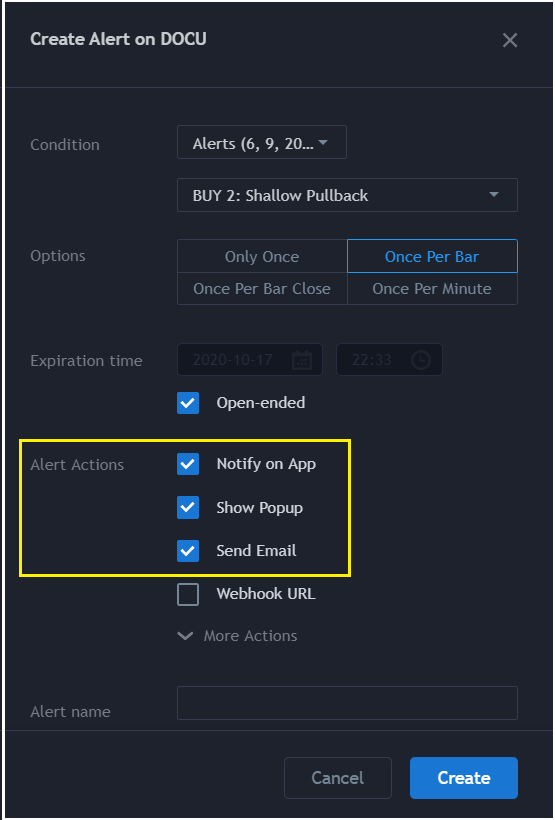
- Step 4. After you pick one specific type of signal you would like to be alerted you need to click “Once per Bar”. If you pick that option alert will sent to you every time the desired signal is generated by the indicator
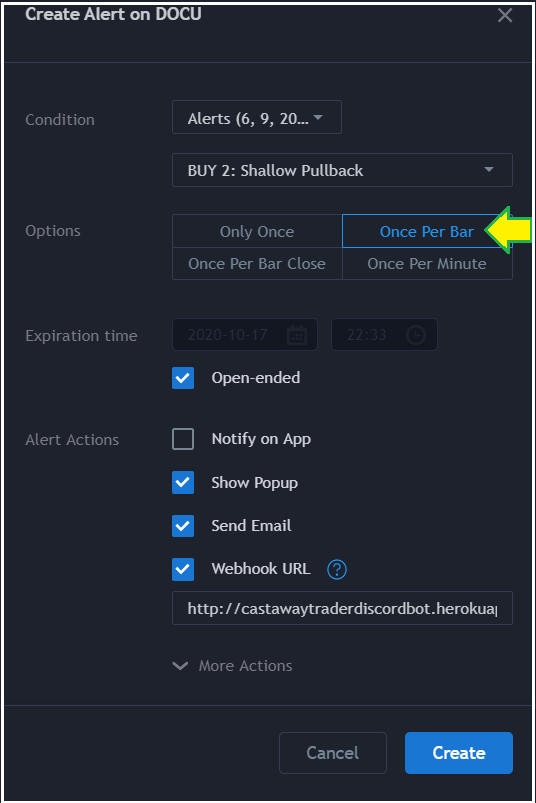
- Step 5. TradingView provides you with three different types of alerts. You can get email notifications, popup notifications or notifications in the mobile app. The best option is to activate them all ( see on the right).
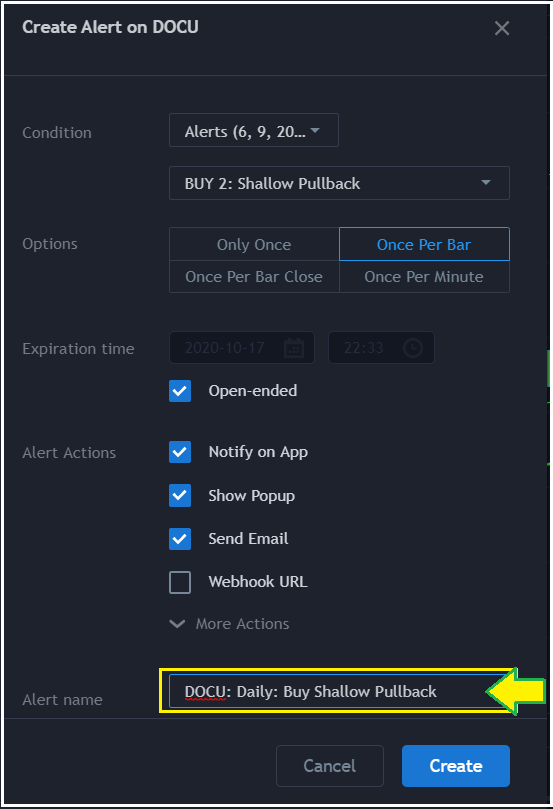
- Step 6. Finally you can define specific message you will get when the signal is generated by the indicator and the alert is sent. I recommend you to always mention the symbol, the timeframe and name of the signal you want to get alerted about:
- I use the following format: “DOCU: Daily: Buy Shallow Pullback”
- click the blue button in the lower right corner of the menu “Create”
How to switch from white background to a black one
- TradingView supports two color schemes, one is dark with black background and another one is light with white background.
- You can quickly switch from one scheme to another
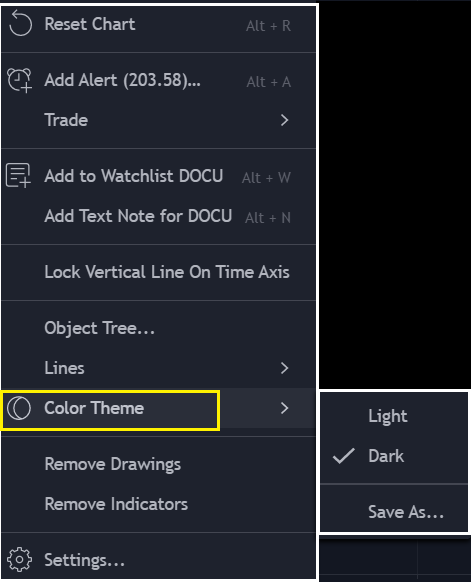
- Just right click any area of your chart and you will get a pop up menu (see on the right)
- You click “Color Theme” and you will get another menu where you can pick either Light or Dark color theme
HIGH RISK WARNING
CastAwayTrader LLC provides a number of indicators to subscribers of specific plans solely for informational purposes, shall not be considered a complete trading system, is not intended to be used as a personalized investment recommendation, and is not attuned to any specific portfolio or to any user’s particular investment needs or objectives.
The indicators provides trade set-ups and alerts that are for educational and hypothetical purposes only and shall not be considered trade recommendations.
Any signals or trading setups drawn by the indicators is not to be construed as an offer to sell or the solicitation of an offer to buy, nor is it to be construed as a recommendation to buy, hold or sell (short or otherwise) any security. All users of the indicators must determine for themselves what specific investments to make or not make and are urged to consult with their own independent financial advisors with respect to any investment decision.
CastAway Trader LLC, the publisher of indicators is not registered as an investment adviser nor a broker/dealer with either the U. S. Securities & Exchange Commission or any state securities regulatory authority.
CastAway Trader LLC reserves the right to un-publish this indicator or change it without any written notice.
Trading stocks, options, or futures carries a high level of risk, and may not be suitable for all investors. Before deciding to trade, you should carefully consider your objectives, financial situation, needs and level of experience. CastAway Trader LLC provides general overview of trading methods that does not take into account your objectives, financial situation or needs. The content of this website must not be construed as personal advice. The possibility exists that you could sustain a loss in excess of your deposited funds and therefore, you should not speculate with capital that you cannot afford to lose. You should be aware of all the risks associated with trading. You should seek advice from an independent financial advisor. Past performance is not necessarily indicative of future profits.
Past results are not indicative of future profits.