II. Bottoming Process. Five Steps to Confirm a Bullish Reversal
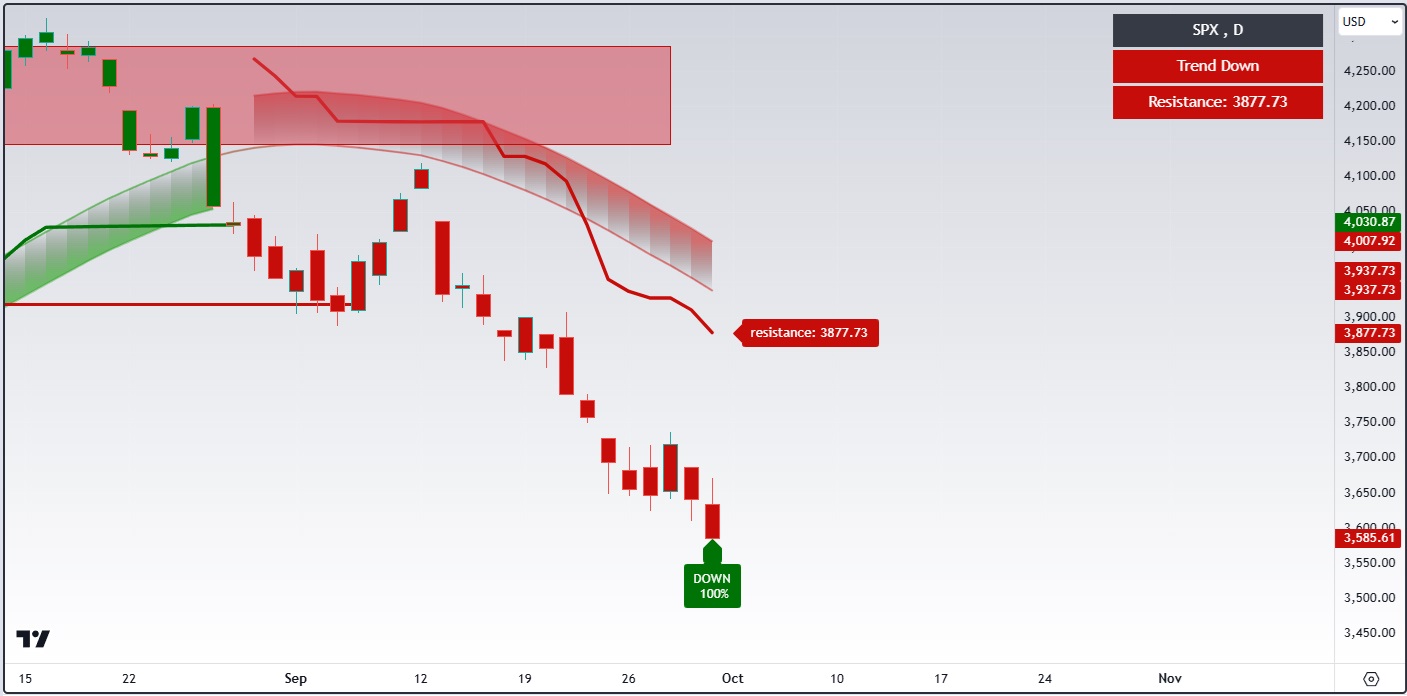
Step 1. Green Down Completion Label (90% or 100%)
First, the indicator prints a green “DOWN 90%” or “DOWN 100%” completion label, signaling that the preceding bearish impulsive (trending) move down is likely exhausted. This is the earliest sign that bears pushing price down may be running out of steam.
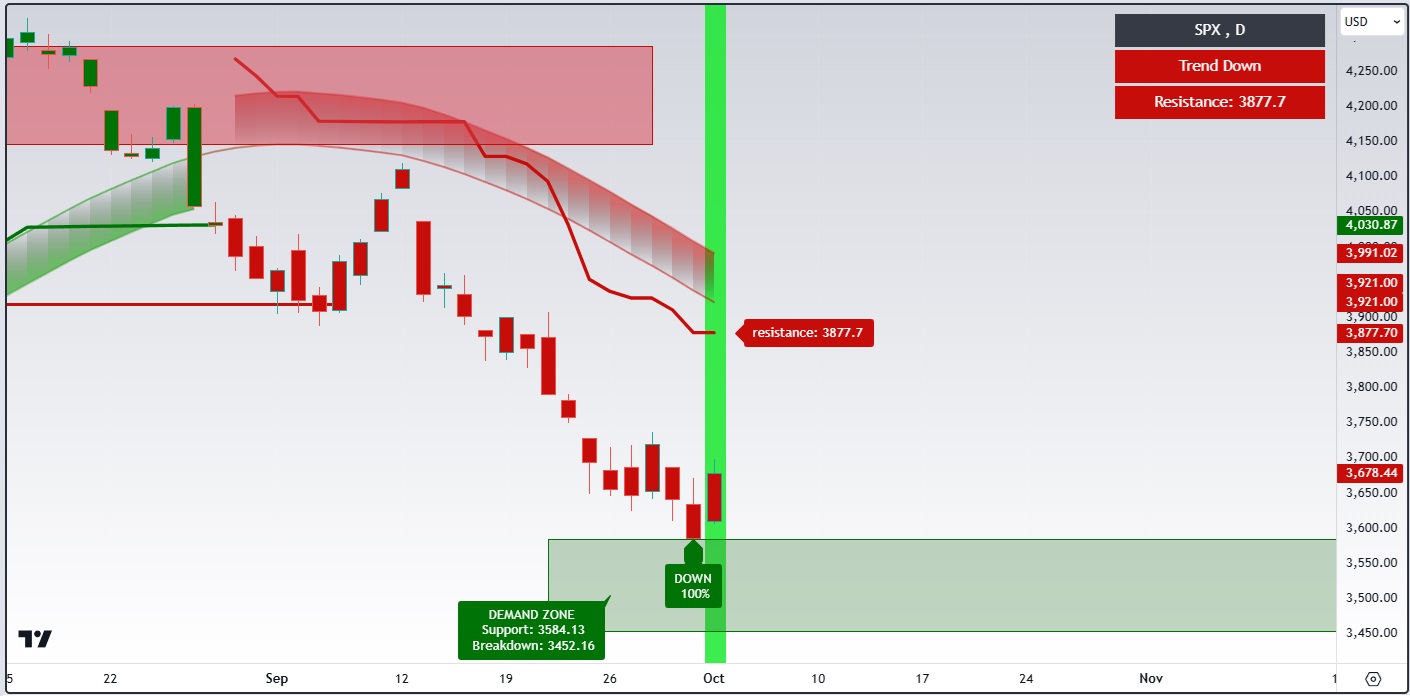
Step 2. Green Box ("Demand Zone") is Drawn
Next, a green Demand Zone (green rectangle) appears, highlighting an important support area where buying pressure is expected to intensify. The indicator expects that buying pressure to stop the decline and possibly reverse the downtrend up.
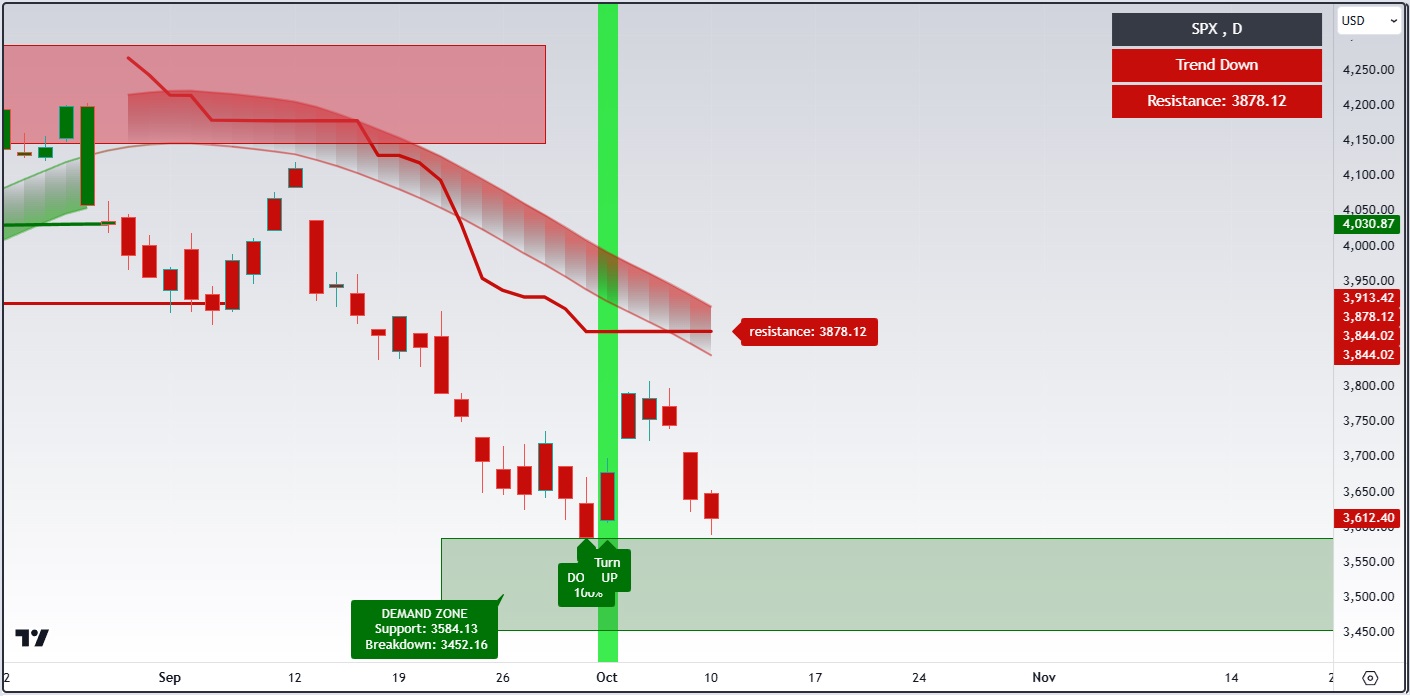
Step 3. "Turn Up" green label
The Turn Upsignal (highlighted, for example, with a green bright vertical line) is your first clear indication that momentum may be shifting from bearish to bullish. Note: The combination of Steps 1, 2, and 3 of the Bottoming Process merely provides preliminary evidence of a possible bullish reversal or just temporary consolidation that can be followed by another leg down. In order to go long we still need confirmation that buyers truly got the upper hand.
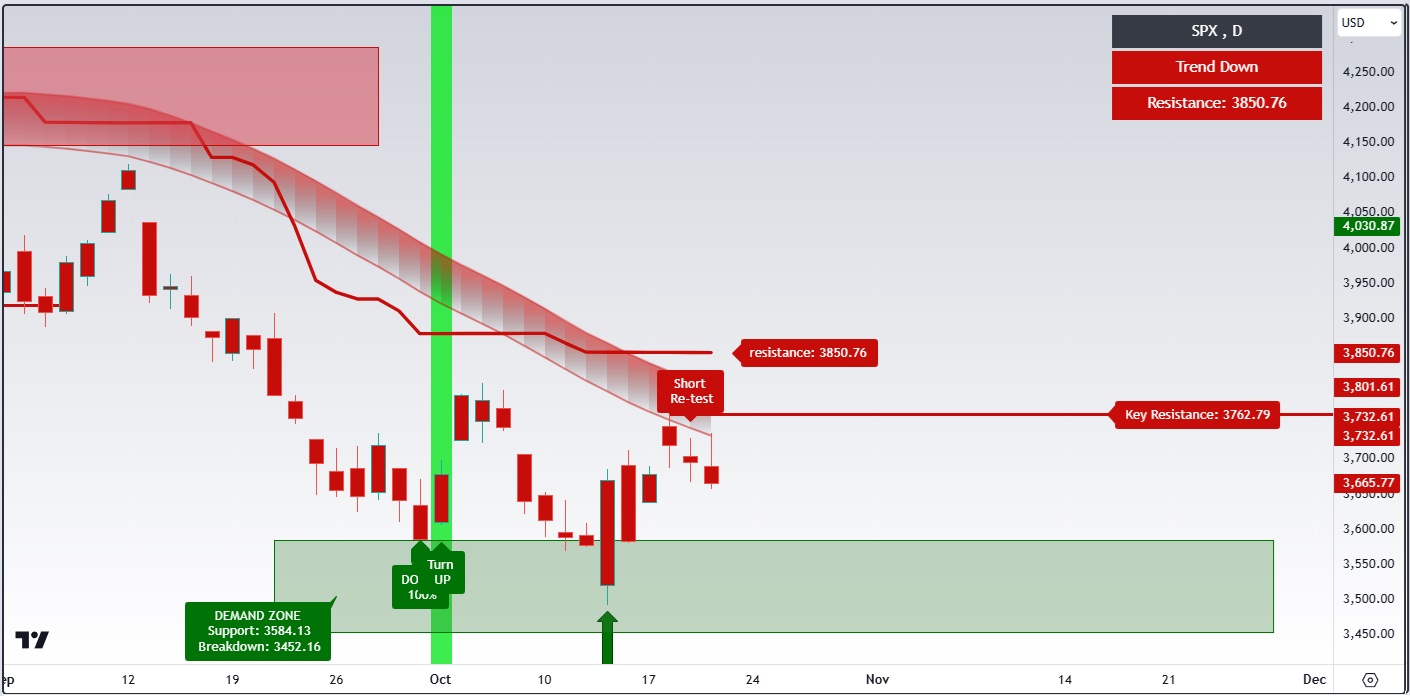
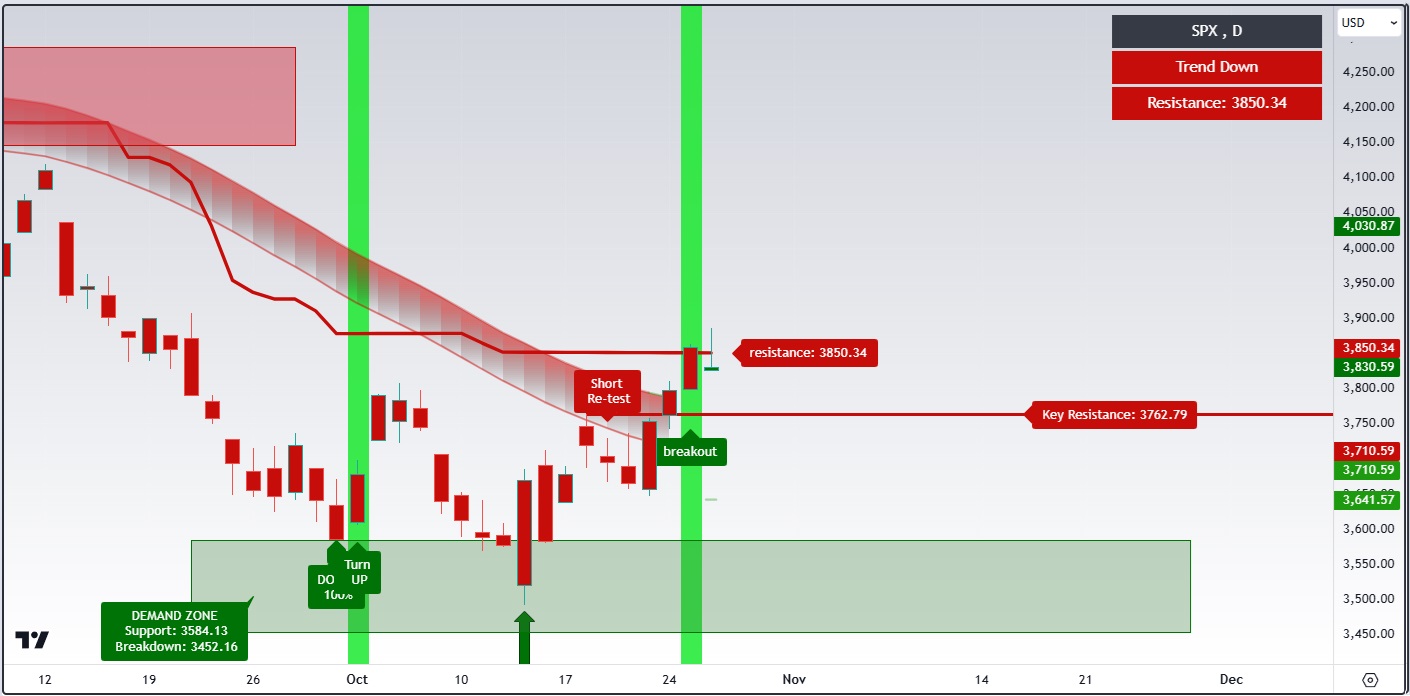
Step 4. Failed test of the declining red Trend Channel.
Every new move up faces two tests. First, bulls have to test resistance of the downward sloped red trend channel. Second, bulls need to test and possibly break over resistance of the red stair step line, the trailing resistance.
When a move up tests the declining red Trend Channel the Impulse Master indicator often recognizes a short setup and prints a red “Short re-test” label. At this point bears are still convinced that this move up is just a temporary bounce and they consider the bounce as a short opportunity. Bears expect this bounce to be followed by another leg down to a lower low.
When bulls managed to violate the red stair step resistance, a green trailing support emerges. You can use that support to set a protective stop for your long trade.
Step 5. Failed move down followed by a breakout.
When the short signal with the red label “Short re-test” is printed the indicator draws a red horizontal line with a label “Key Resistance”. The high made by the pullback to the red declining trend channel becomes an invalidation level for the bearish continuation scenario. That means that break over that level invalidates potential for extension of the move down to a lower low and confirms a bullish reversal.
Note that the indicator draws the green label “breakout”. Note that by that moment price violates both, the red downward sloped trend channel and the red stair step line, the trailing resistance.
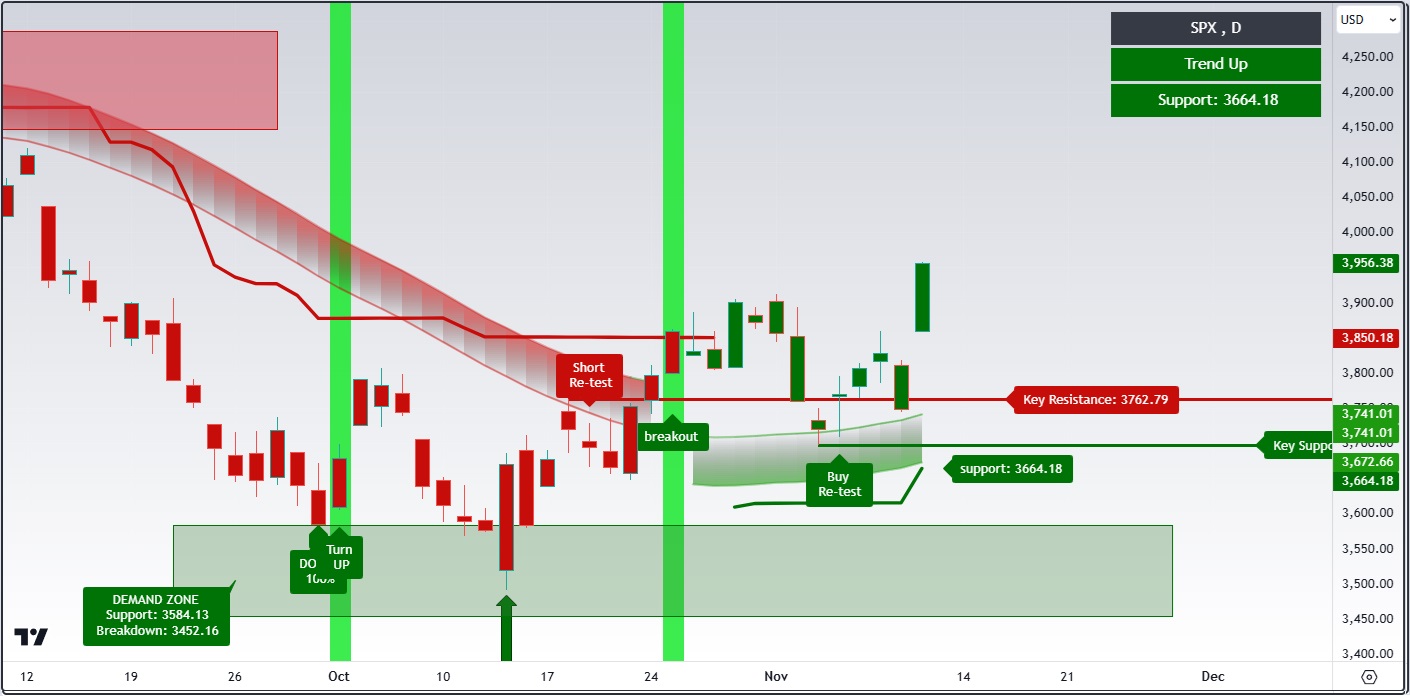
Step 6. "Buy re-test" green label is a reliable Long Setup
A textbook breakout-followed-by-retest pattern is familiar to most traders. This indicator simplifies the process of identifying this bullish reversal setup. Often, after bears break over the resistance of the trailing resistance, the red stair step line, bears quickly step in to attempt to rescue the downtrend. This creates a pivotal moment as bears test the strength of the newly established uptrend. As prices push back down, they typically encounter support at the upward sloped green trend channel. If the indicator detects signs of hesitation or weakness of bears at this support level, it highlights a potential long setup by displaying a green label: ‘Buy Re-test.’
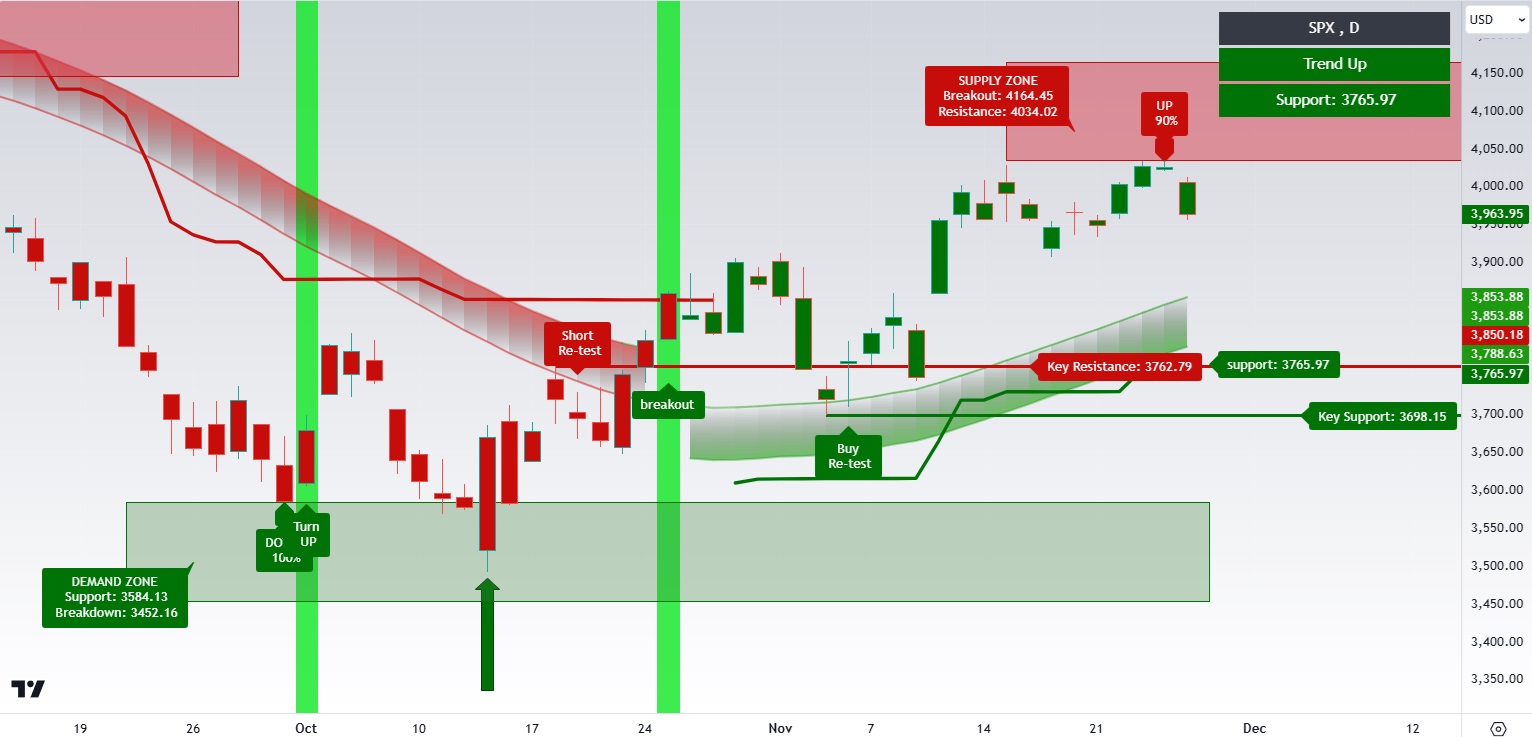
On the chart below you can see that failure of bears to break under the upward sloped green Trend Channel attracted more buyers. Once price made a higher low over the upwards sloped green Trend Channel what followed next was an accelerated trending move up.