Subscription: Value Stocks
GILD looks having bottomed!
Gilead Sciences, Inc. is a biopharmaceutical company that discovers, develops and commercializes medicines in areas of unmet medical need. The Company’s portfolio of products and pipeline of drugs includes treatments for Human Immunodeficiency Virus/Acquired Immune Deficiency Syndrome (HIV/AIDS), liver diseases, cancer, inflammatory and respiratory diseases and cardiovascular conditions.
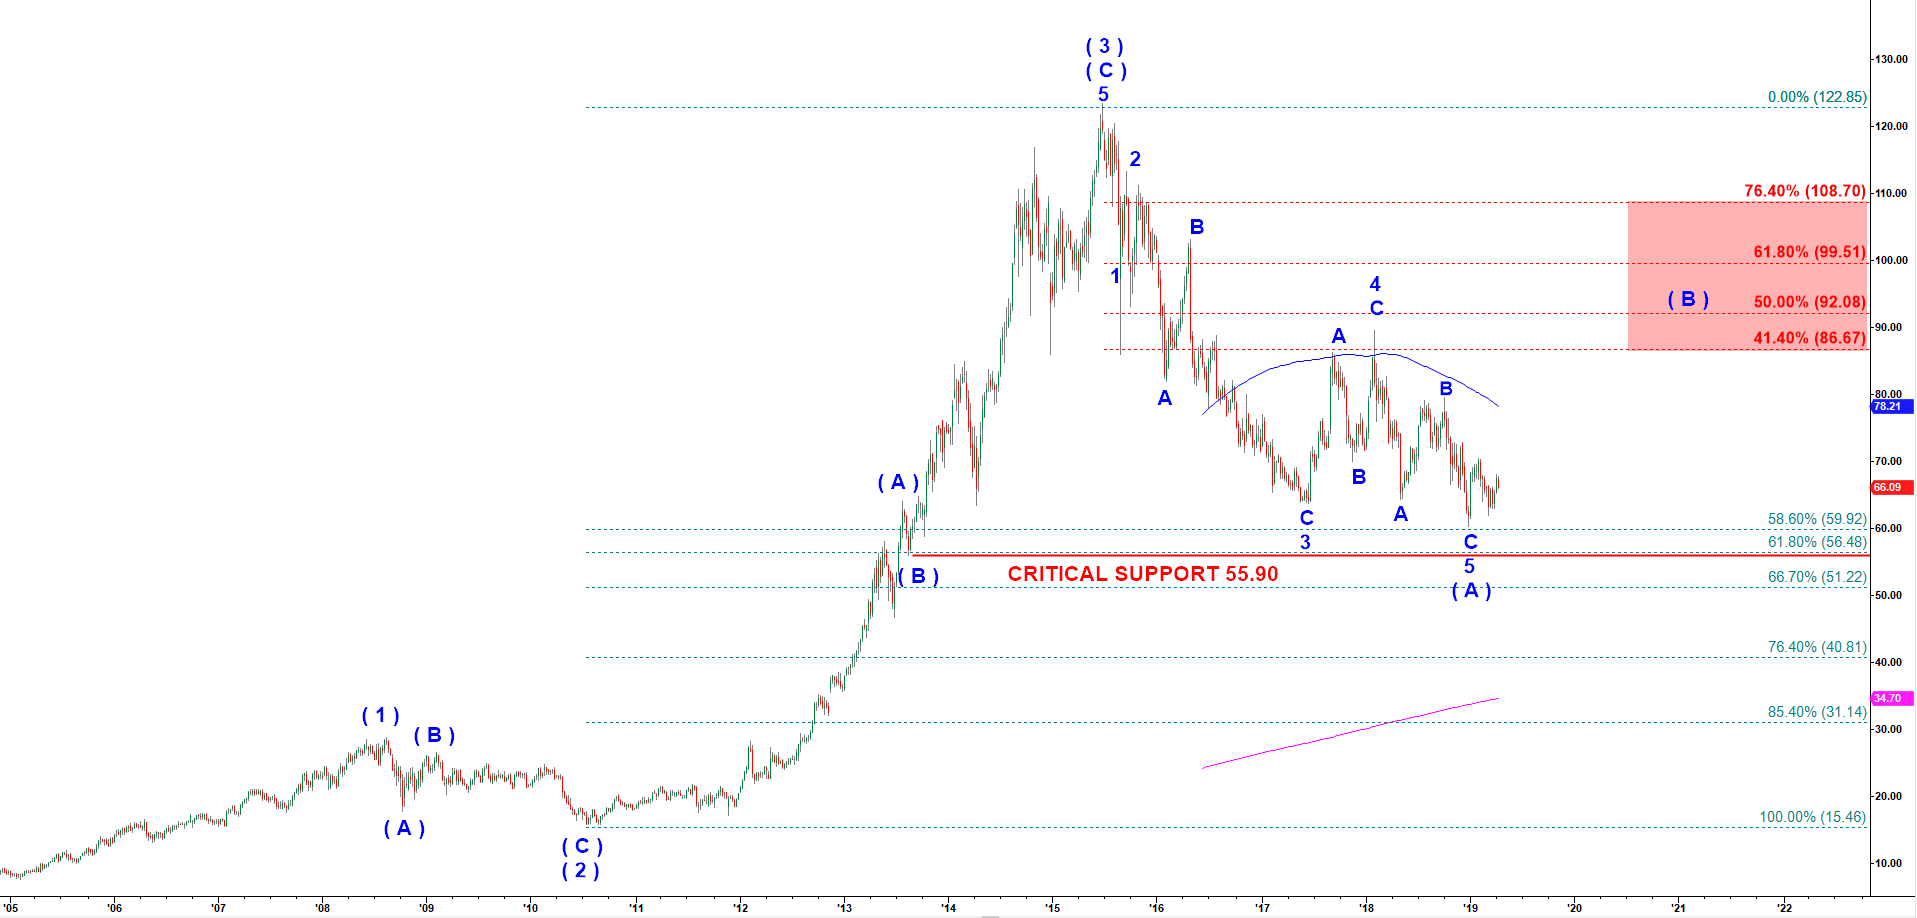
GILD has been playing a huge five wave fractal that started in 1997. The wave ( 3 ) out of those five wave topped at 123.37 in June 2015. Since then GILD has been on a steady decline following an impulsive structure.
And at this point I can count five completed waves down. That implies that the drop off 2015 was only the first leg ( A ) down and there will be the second leg down in wave ( C ) that may make lower lows. However, out of the bottom of that completed wave ( A ) down we are supposed to get a sufficient pullback in wave ( B ) down. Let’s zoom-in to a Daily chart to see more details.
GILD - Weekly chart updated on 4/9/2019
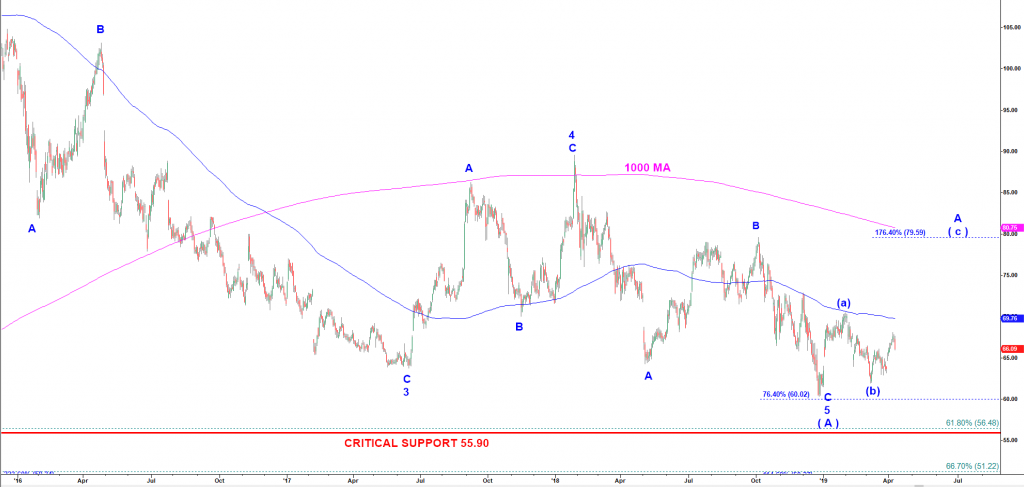
Off the top of wave 4 up ( $89.54 in February 2018 ) GILD was supposed to drop in the final wave 5 down structured as A down, B up and C down. And this is exactly what we got. The minimum extension for the final subwave C of 5 is 76.4% of the wave A of 5. And Gild hit that target testing $60.00 level in December 2018.
GILD - Daily chart updated on 4/9/2019
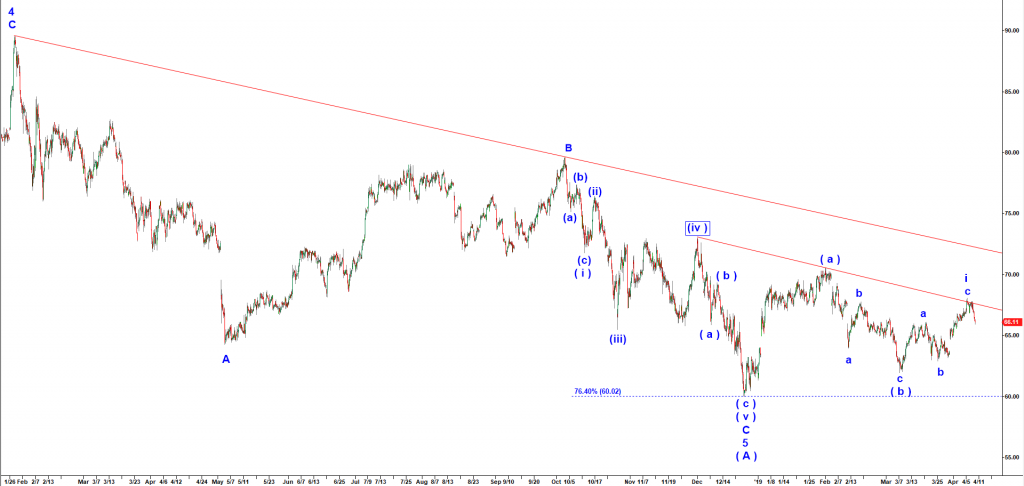
Off the bottom in December 2018 GILD played a nice five wave rally I count as ( a ) (see 90 min chart below). That wave ( a ) up followed by a corrective looking decline structured as a-b-c in wave ( b ) down that bottomed at $61.96 on 7 March 2019. Now we should expect an impulsive looking rally in subwave ( c ) up that may target $80.
GILD - 90 min chart updated on 4/9/2019
Financial Strength
The company has great profitability ratios and is cheap. It traded at an attractive 11.5 Price-to-Free-Cash-Flow. What is interesting is that how with such a profitable business it managed to increase its debt load to such a high level of 2.65 x EBITDA. That level is close to the upper band of high but acceptable debt load. And the cherry on top is 3.5% dividend.
Operating Margin
37%
Net
Margin
24.7%
Return on Capital
240%
Price-to-Free-Cash-Flow
x11.5
Debt-to-EBITDA
x2.65
Dividend
Yield
3.5%