XLF - retested broken resistance from above
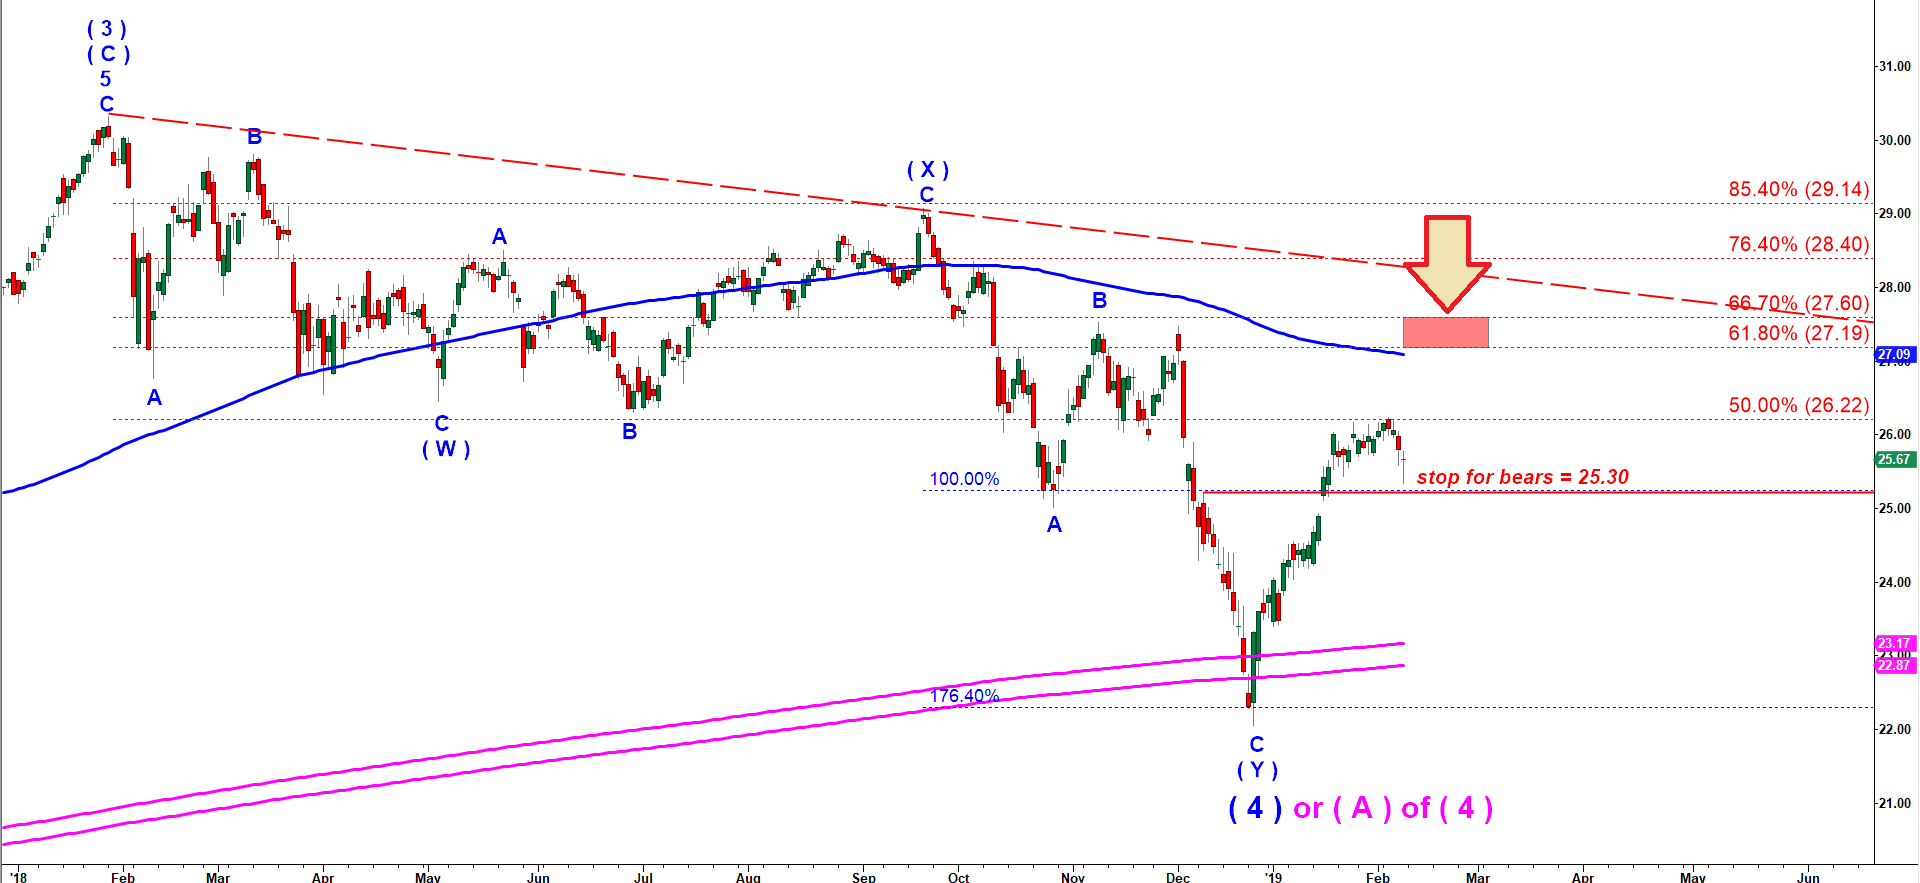
Off the top in January 2018 financials declined in a corrective (W)-(X)-(Y) structure. The question whether it was all of the large corrective wave ( 4 ) down remains open.
The move up off December 2018 low does not have a clear structure. However, in my previous post I suggested a stop for bears. If bulls could contain that pullback under 25.30 we could have got another move down to a new lower low. However, that resistance was decisively taken out killing a potential scenario with immediate move lower.
Because the rally does not have a good structure we should pay attention to major retracement fibs, trend lines and major moving averages.
First, on February 5th XLF hit 50% retracement fib of the whole decline from January 2018 to December 2018. It got rejected off that level and came back down to retest the broken resistance at 25.30/ Look at the doji candle formed last Friday. It’s a sign of indecision of bears. As long as we stay over 25.30 the move up may continue.
The next obvious target is 27.19 which is a confluence of 200 MA and 61.8% retracement of the decline in 2018. And the following important resistance is 27.60 (66.7% fib ).
XLF - 120 min chart updated on 9 February 2019