XLF - target zone for this correction is still 6% lower
In my previous update on XLF posted on 17 Nov 2018 I explained why I think that the top made in January 2018 was an important long term top of the wave ( 3 ) up. I also explained that we were in large corrective wave ( 4 ) down targeting much lower levels. Since that post price dropped almost 10% from 26.79 to 24,52.
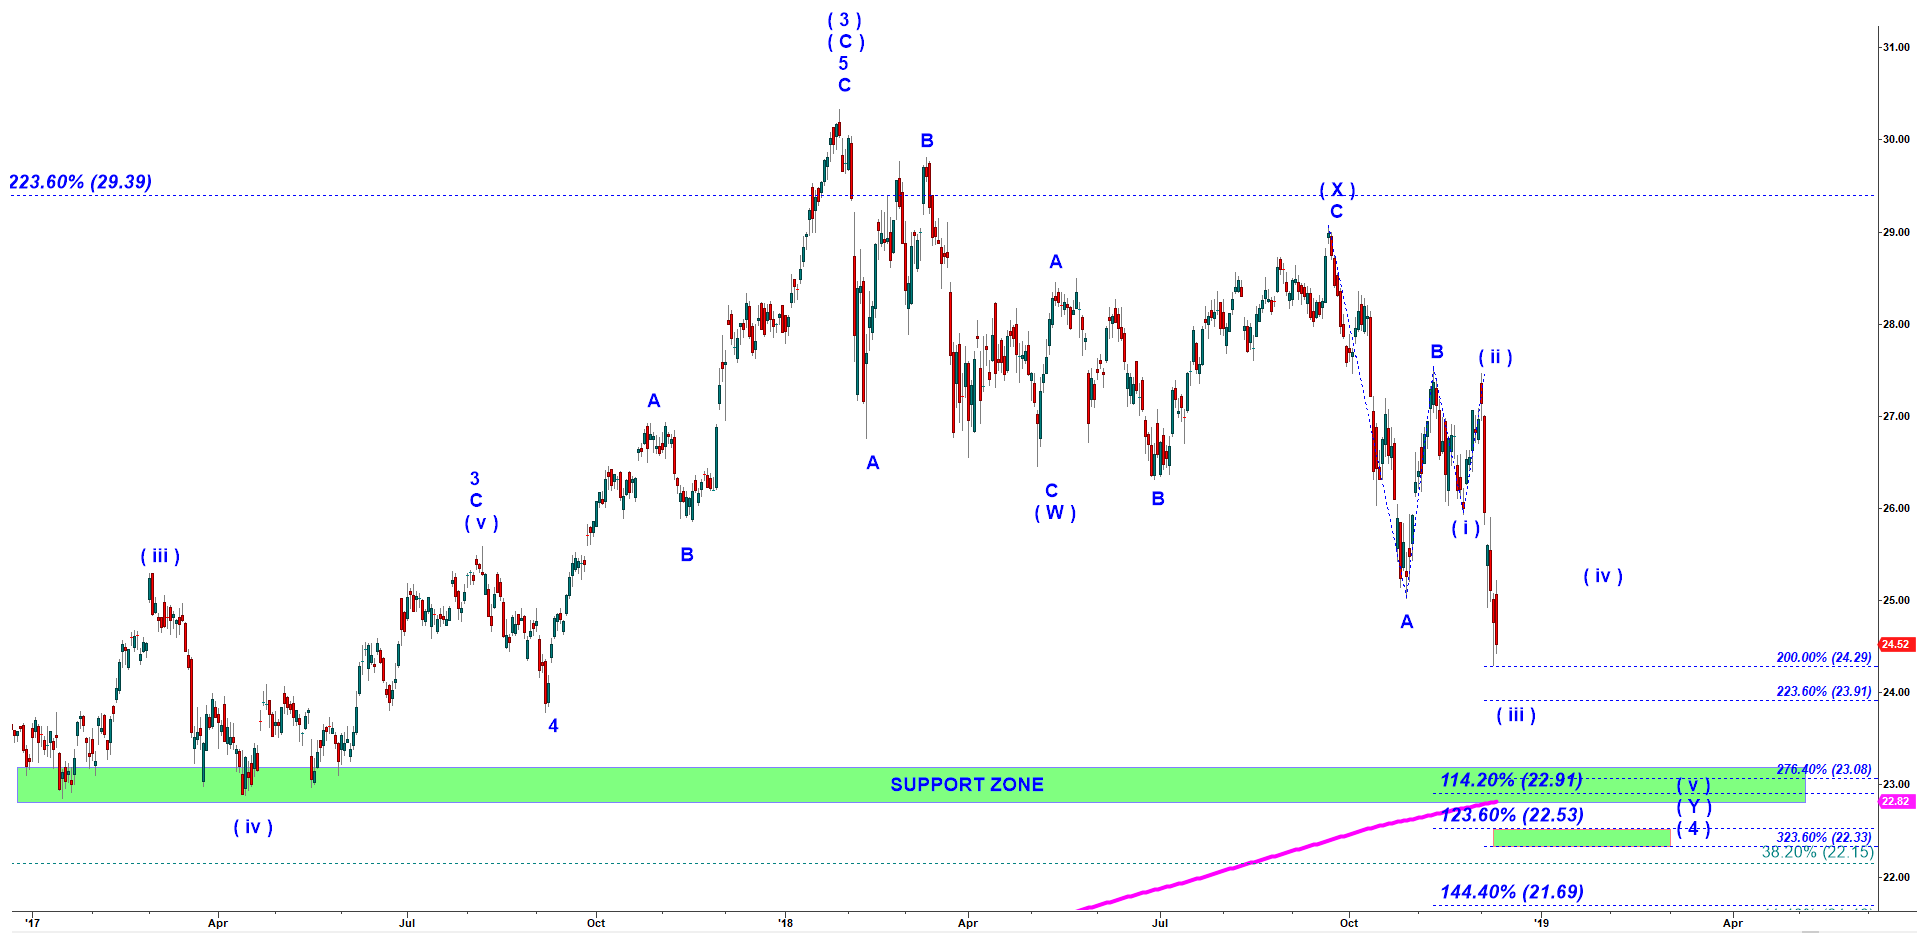
Now it is time to focus on the corrective structure of that large wave ( 4 ) down we have been in for 11 months. In my opinion we deal with a double three corrective structure that is composed of two A-B-C corrective structure connected by another A-B-C structure we label as wave ( X ) up. It looks like the second A-B-C structure is a simple zig-zag meaning that waves A and C of that structure are impulsive waves subdivided into five waves. We are now either completed or close to completion to wave ( iii ) of the very final wave C of ( Y ) of ( 4 ) down. That means that we should soon expect a corrective pullback up in wave ( iv ) and then another drop in the wave ( v ).
At this point I would point your attention to the green target box on the chart below. That is a high probability bottoming zone (23.17-22.85) for the whole corrective structure in the wave ( 4 ) down.
XLF - Daily chart updated on 11 December 2018