XLF - hit the target but still may need another lower low
XLF offers exposure to the heavyweights in the US financials segment. It’s main holdings are large banks.
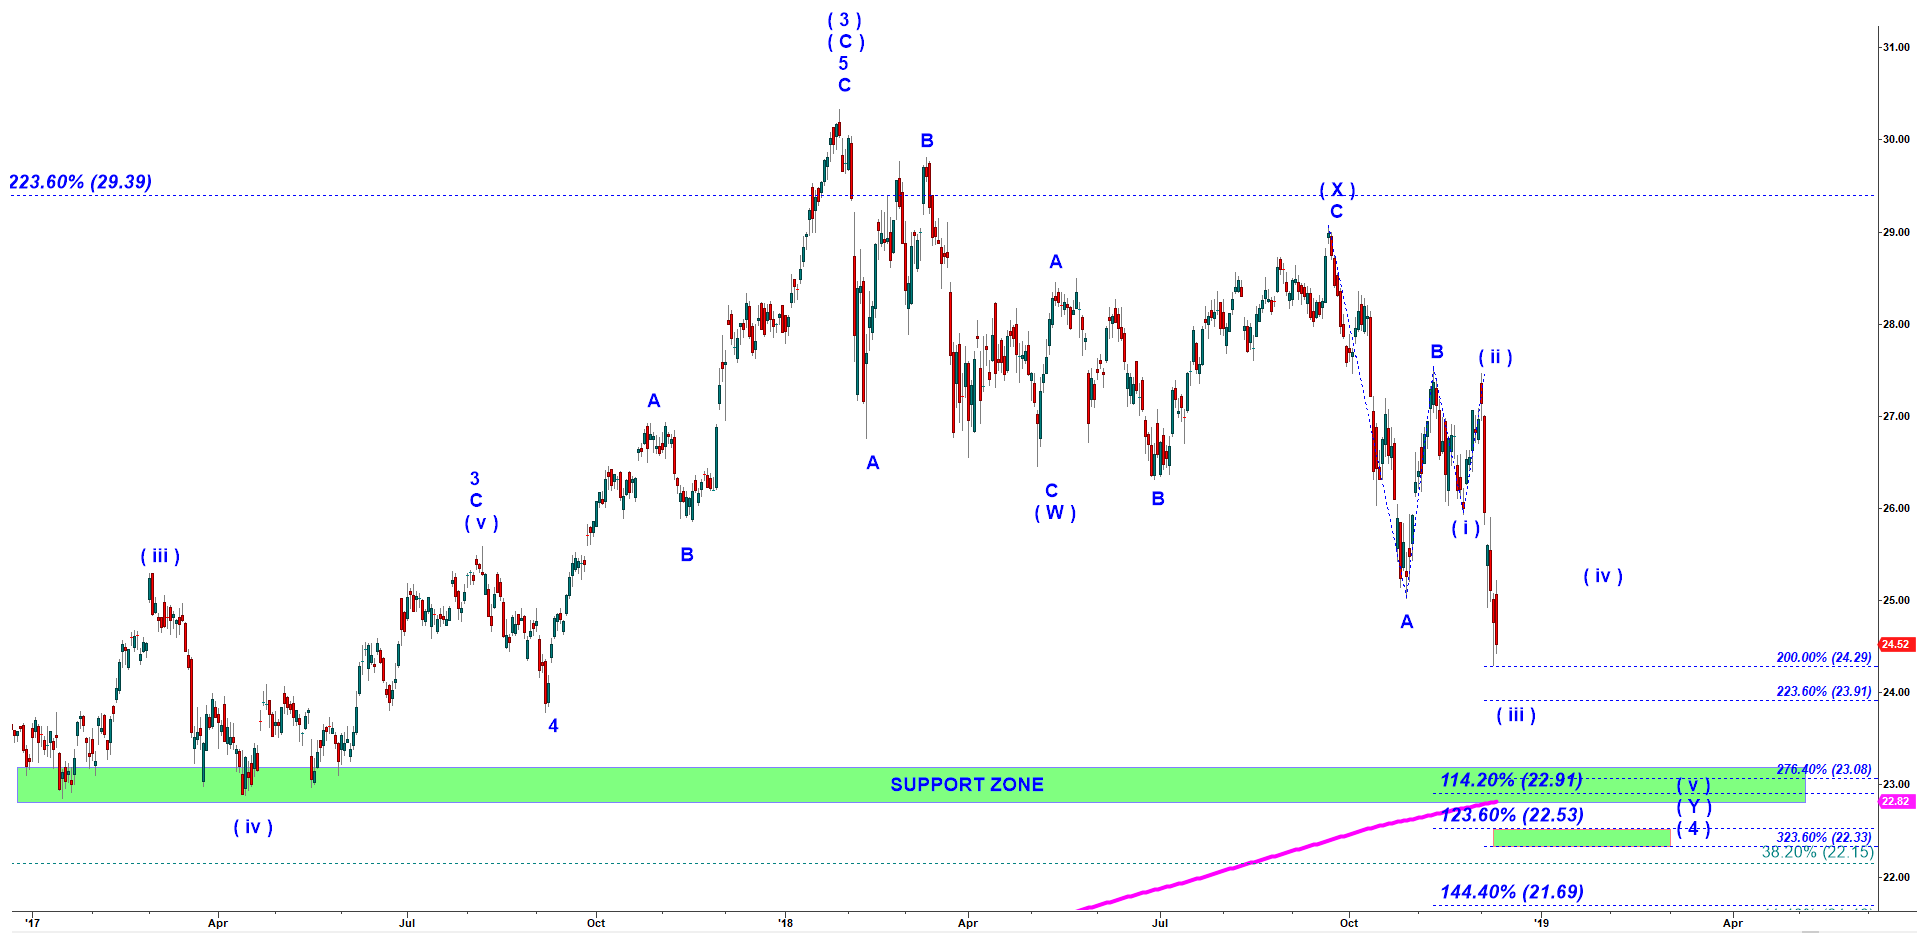
In my previous analysis of XLF posted on 11 December 2018 I expected it to find a bottom in the area of That is a high probability bottoming zone (23.17-22.85). I expected a meaningful corrective wave ( iv ) up and the final drop in the wave ( v ) down that would complete the whole corrective structure in the wave ( 4 ) down off the top of wave ( iii ) up that topped in January 2018.
XLF - Daily chart updated on 11 December 2018
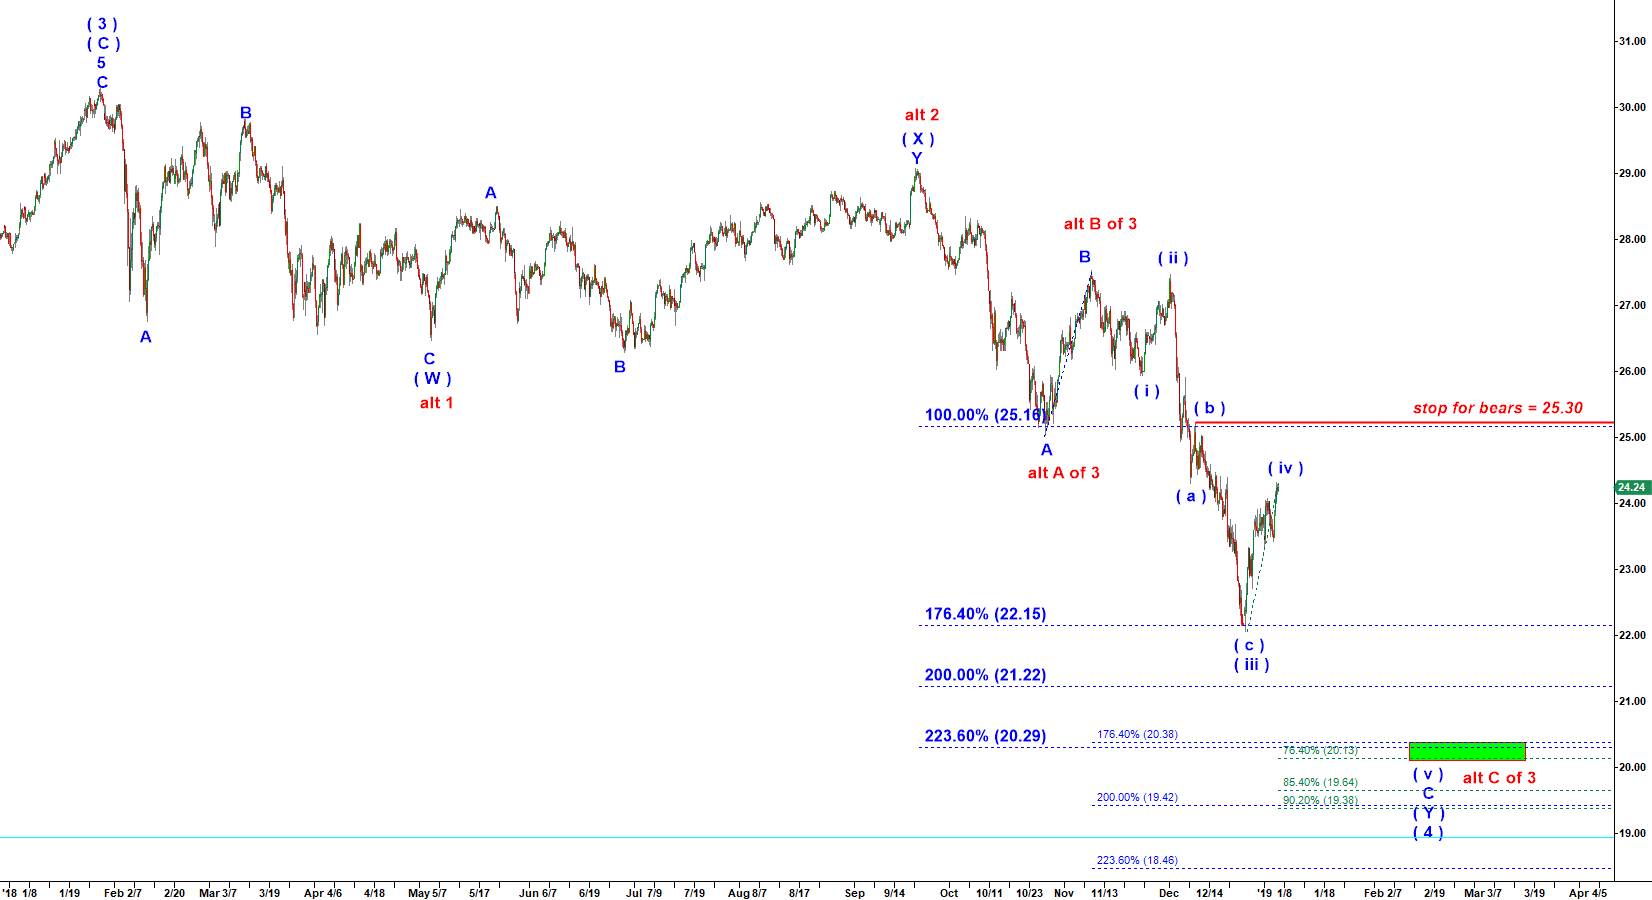
On 26 December 2016, one and a half months later, XLF dropped to 22.06. However, the problem is that we do not have a completed structure of that final move down in the wave C of ( Y ) of ( 4 ). That wave C should be subdivided into five subwaves. And even though it hit my target box and saw a nice bullish reaction off the target box I can not declare it is having bottomed. The ideal scenario will be another drop to a new lower low in the 20 sh area.