XLE - started a rally to $120
I have been looking at XLE for a while and could not get any reliable count. Sometimes you just do not see that. Then you just need some time to develop a fresh eye. My follower on Twitter asked me to look at that and I decided to give it another chance. And this morning I got a clear vision of the bullish count below. Now I wonder why I did not see it last time?!
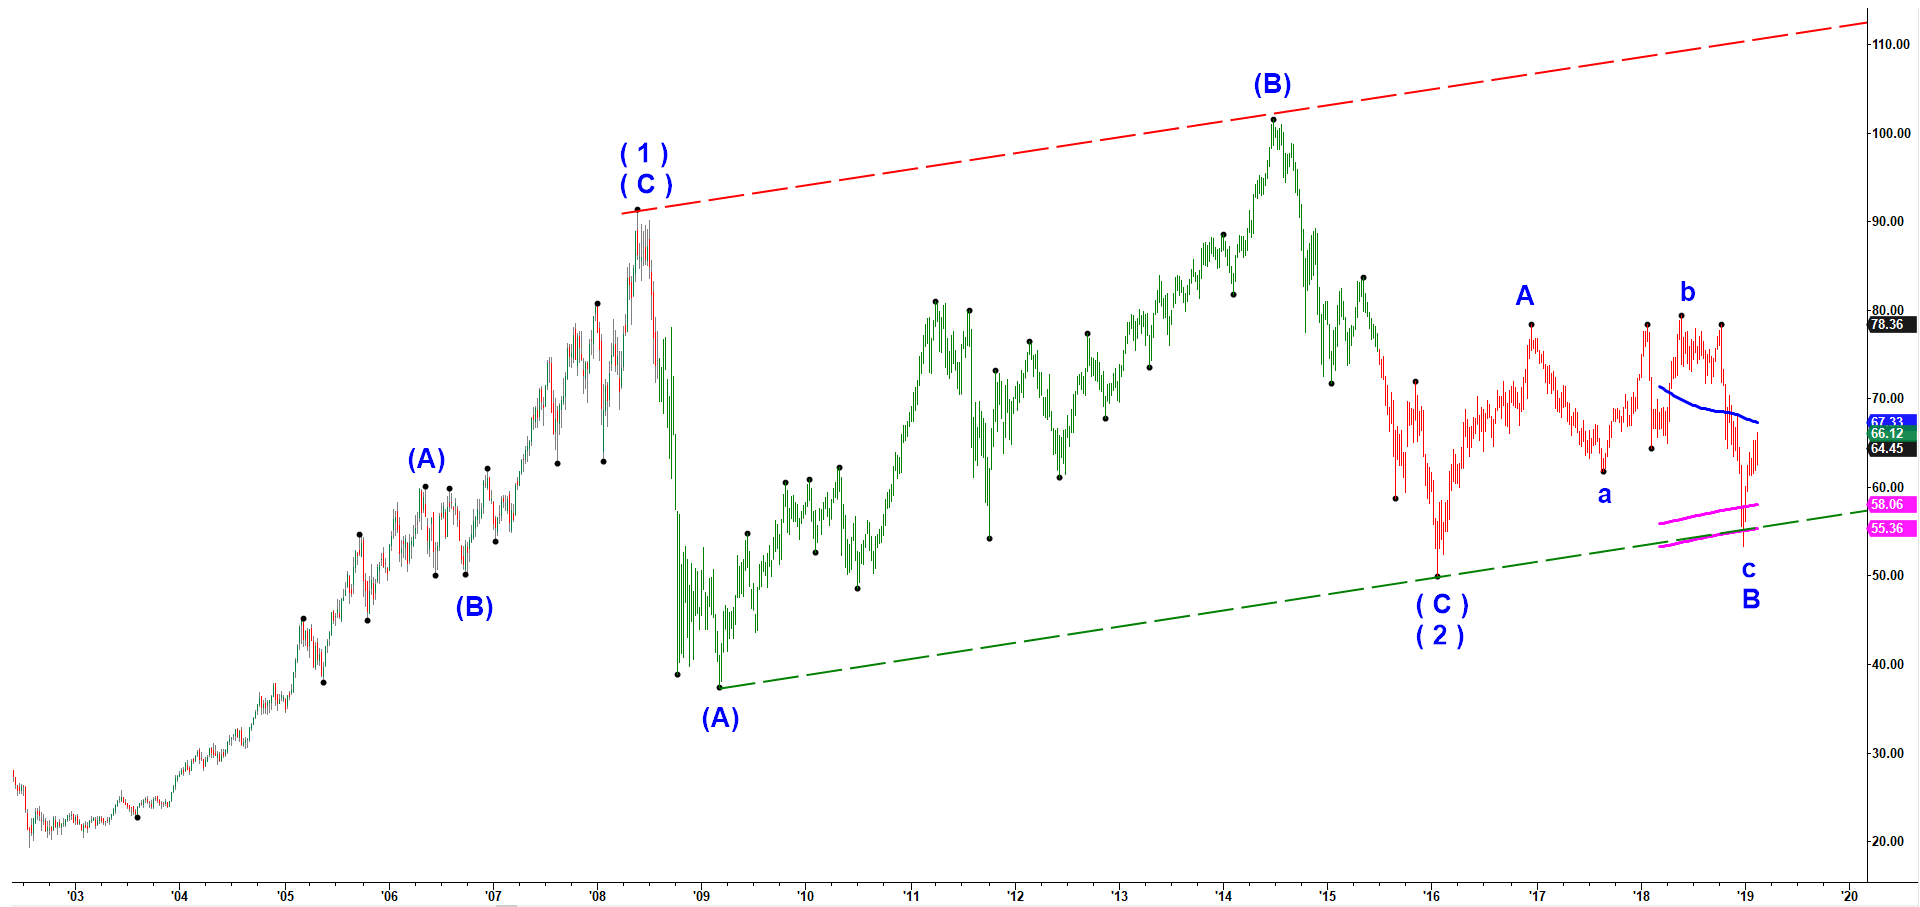
My chart gives me a major low at 19.38 made in July 2002. Off that low I get clear five waves up int the top at 60.15 reached in May 2006. I count that rally as a wave (A) of ( 1 ).
Then we got a flat corrction shaped as A-B-C which I count as a corrective wave (B) of ( 1 ).
That pullback was followed by another strong rally in wave (C) of ( 1 ) topped at $91.42 in May 2008. As you may noticed it topped right after two years since the previous top in wave (A) of ( 1 ).
Off that major May 2008 top it played a perfect (A) down – (B) up – (C) down correction in the wave ( 2 ) down. Note that wave (B) managed to make a higher high over the previous high reached by wave (C) of ( 1 ). In my video course I explain that this type of correction is called “running flat”. That is a sign that bulls are in control because even a corrective wave (B) up managed to drive price to a new higher high. Note that the final leg of the correction, wave (C) of ( 2 ) could not even retest the low made by the first leg of the correction, wave (A) of ( 2 ). Now we have a clear channel with upward slope.
Off the major low at $49.93 established by the wave (C) of ( 2 0 in January 2016 we are supposed to get an impulsive looking rally subdivided into five waves and targeting 114.4% or 123.6% extension of the wave ( 1 ) up. Moreover, the price is expected to surf that upward sloped channel. That gives us a target around $120. So far we got subave A o 1 up topped at $78.45 in December 2016 followed by a corrective wave B of 1 bottomed at $53.36 in December 2018. Did you notice that again there were two years in between of those two price extremes? From that December 2018 low we are supposed to get a rally in wave C of 1 targeting at least $81.70. However, it can easily stretch to $87.80.
XLE - weekly chart updated on 17 February 2019