Biotech ETF seeks to provide investment results corresponding to the total return performance of the S&P Biotechnology Select Index.
XBI topped in June 2018. Off that top we got an impulsive looking decline clearly subdivided into five waves.
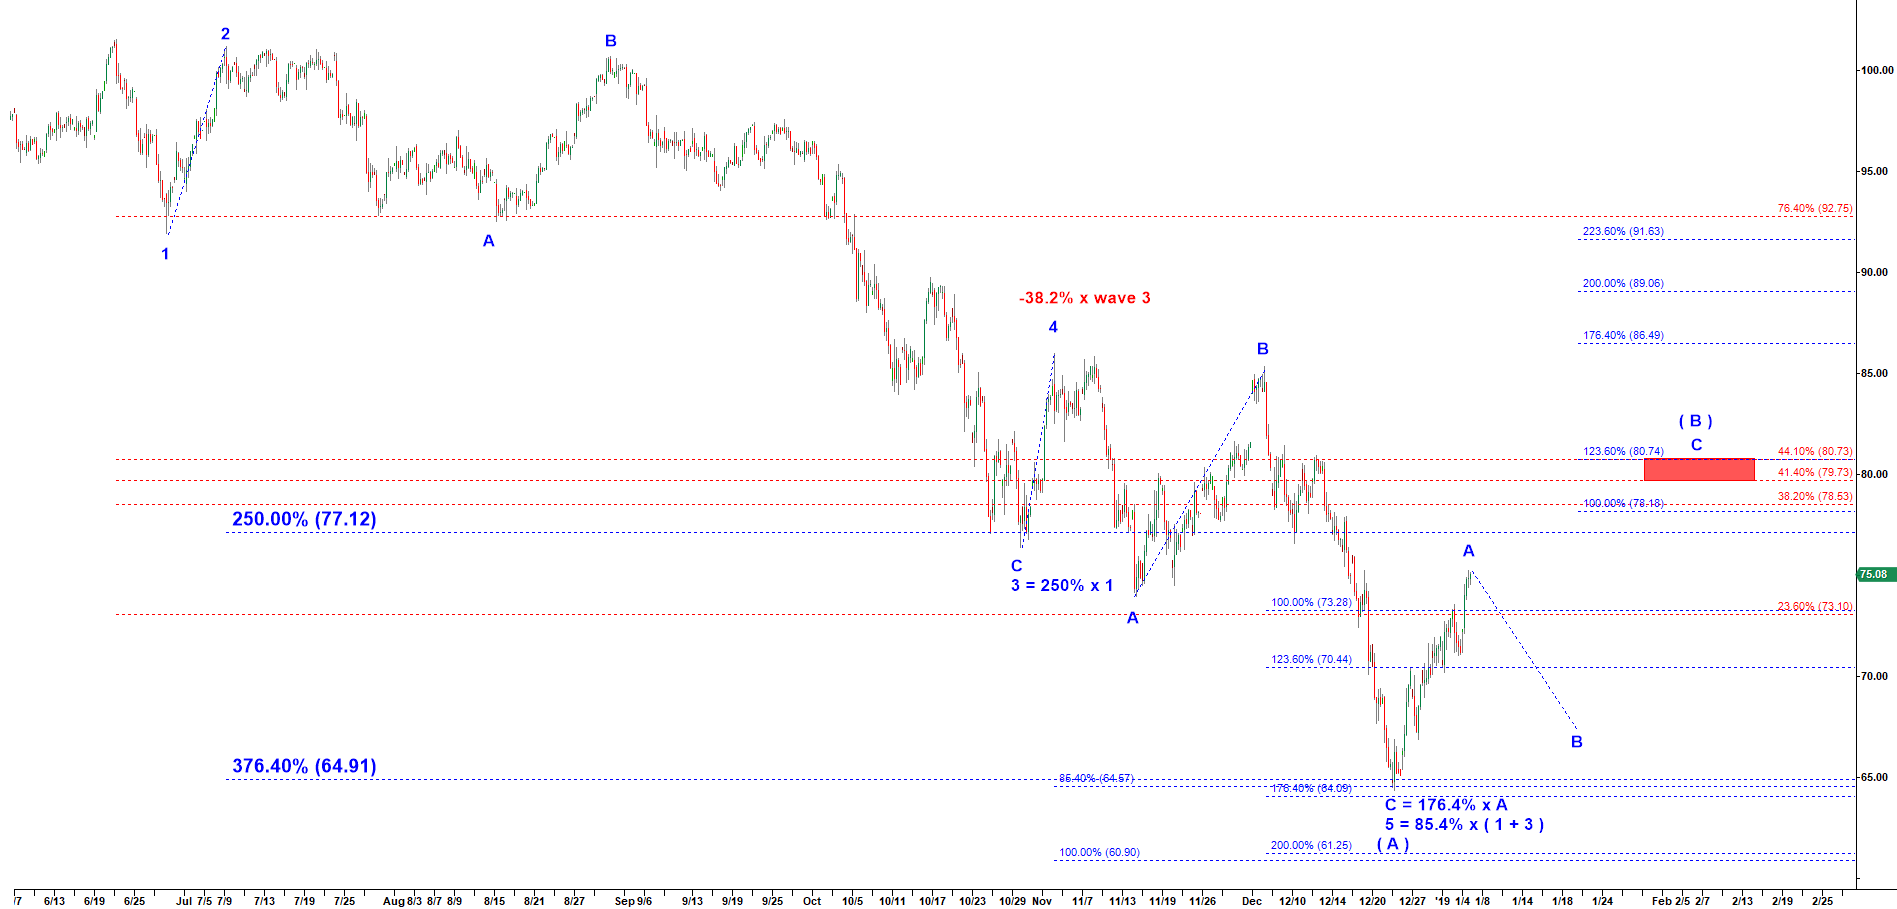
At this point we have two alternative scenarios. On the chart below you can see a bullish scenario where that structure may have bottomed on 24 December 2018.
XBI - 120 min chart updated on 5 January 2019 Bullish Scenario
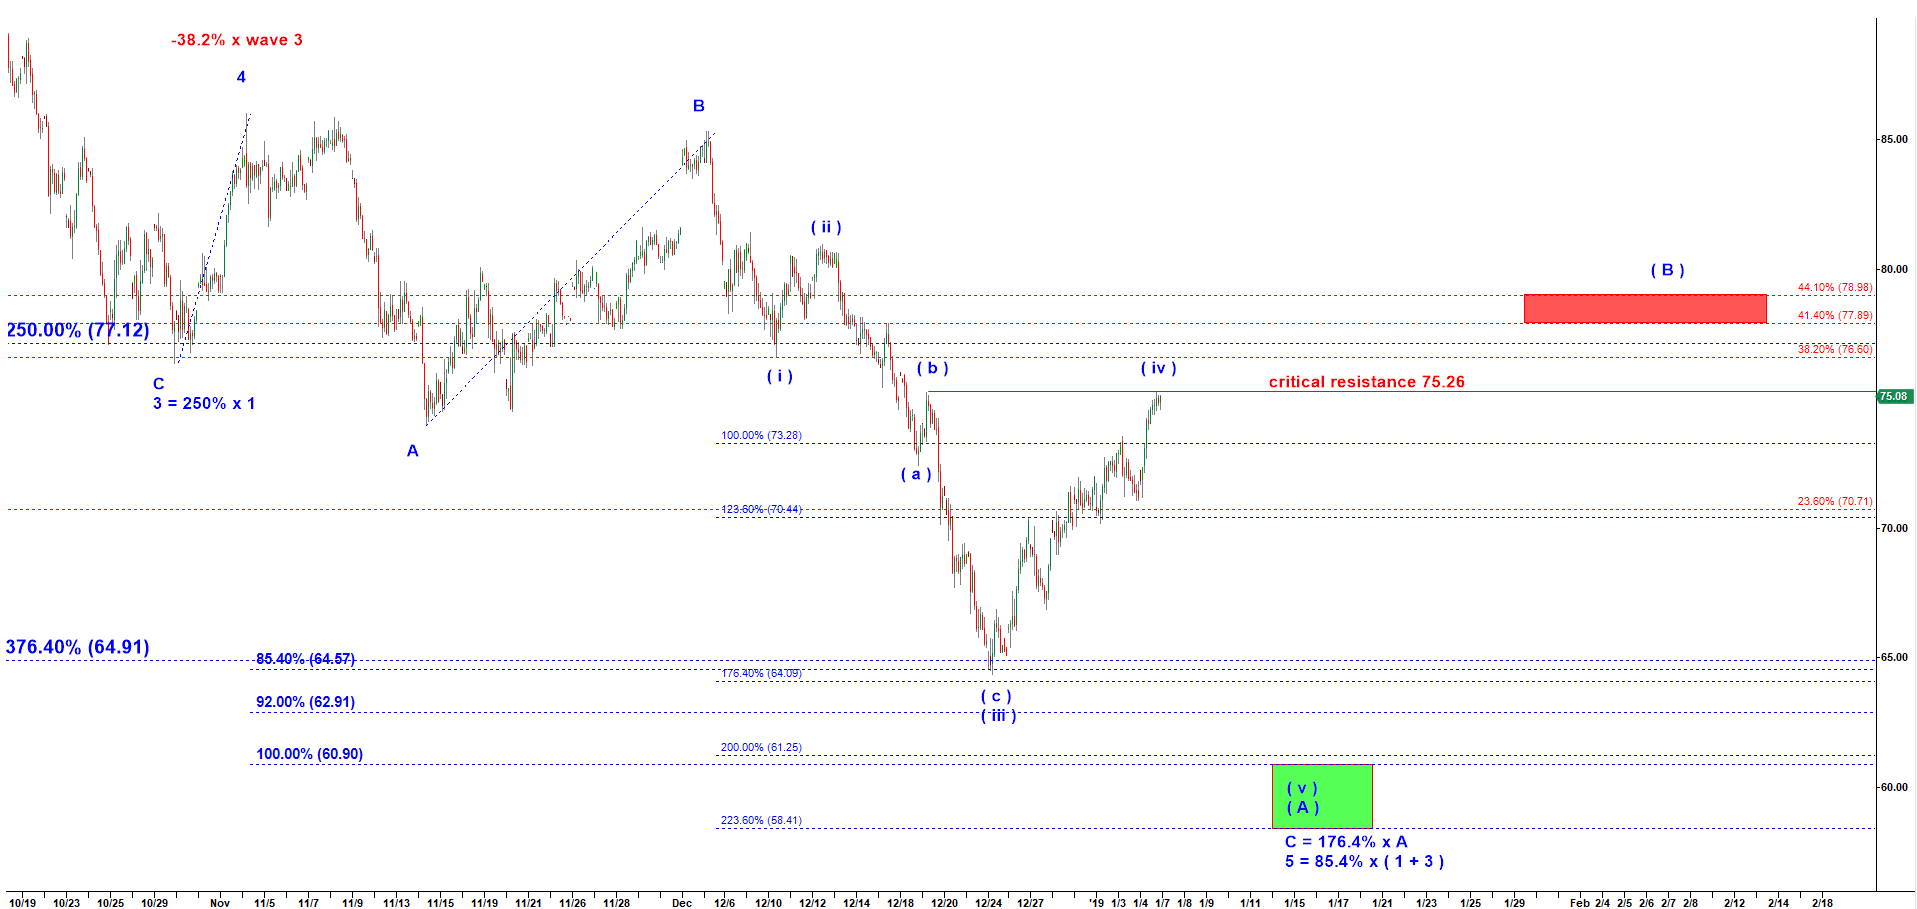
However, I should present you another slightly more bearish scenario. Before I start I should note that the main idea is the same. XBI either has finished the five wave decline off the June 2018 top or need another lower low to complete it. The bearish scenario implies that we may get one more drop to a new low to complete wave ( v ) of ( A ). Under both scenarios we should get a corrective wave ( B ) up that could retrace up between 38.2% to 61.8% of the whole decline off 2018 top.
XBI - 45 min chart updated on 5 January 2019 Bearish Scenario