This is a report that I sent to my subscribers at 9:05 AM on Friday, May 24th, 2019. When TVIX traded at 21.82 I predicted a rally to 25 – 25.80 region. Five days later, on 29 May 2019 TVIX topped at 25.61. I am really proud of that prediction. Because it’s relatively easy to predict continuation of an impulsive (trending move). But it takes thousand of hours counting and trading to get to the level when you can predict corrective internal subwaves of corrective waves that look erratic even for many experienced analysts.
Subscription: Access to Micro Counts of US indices
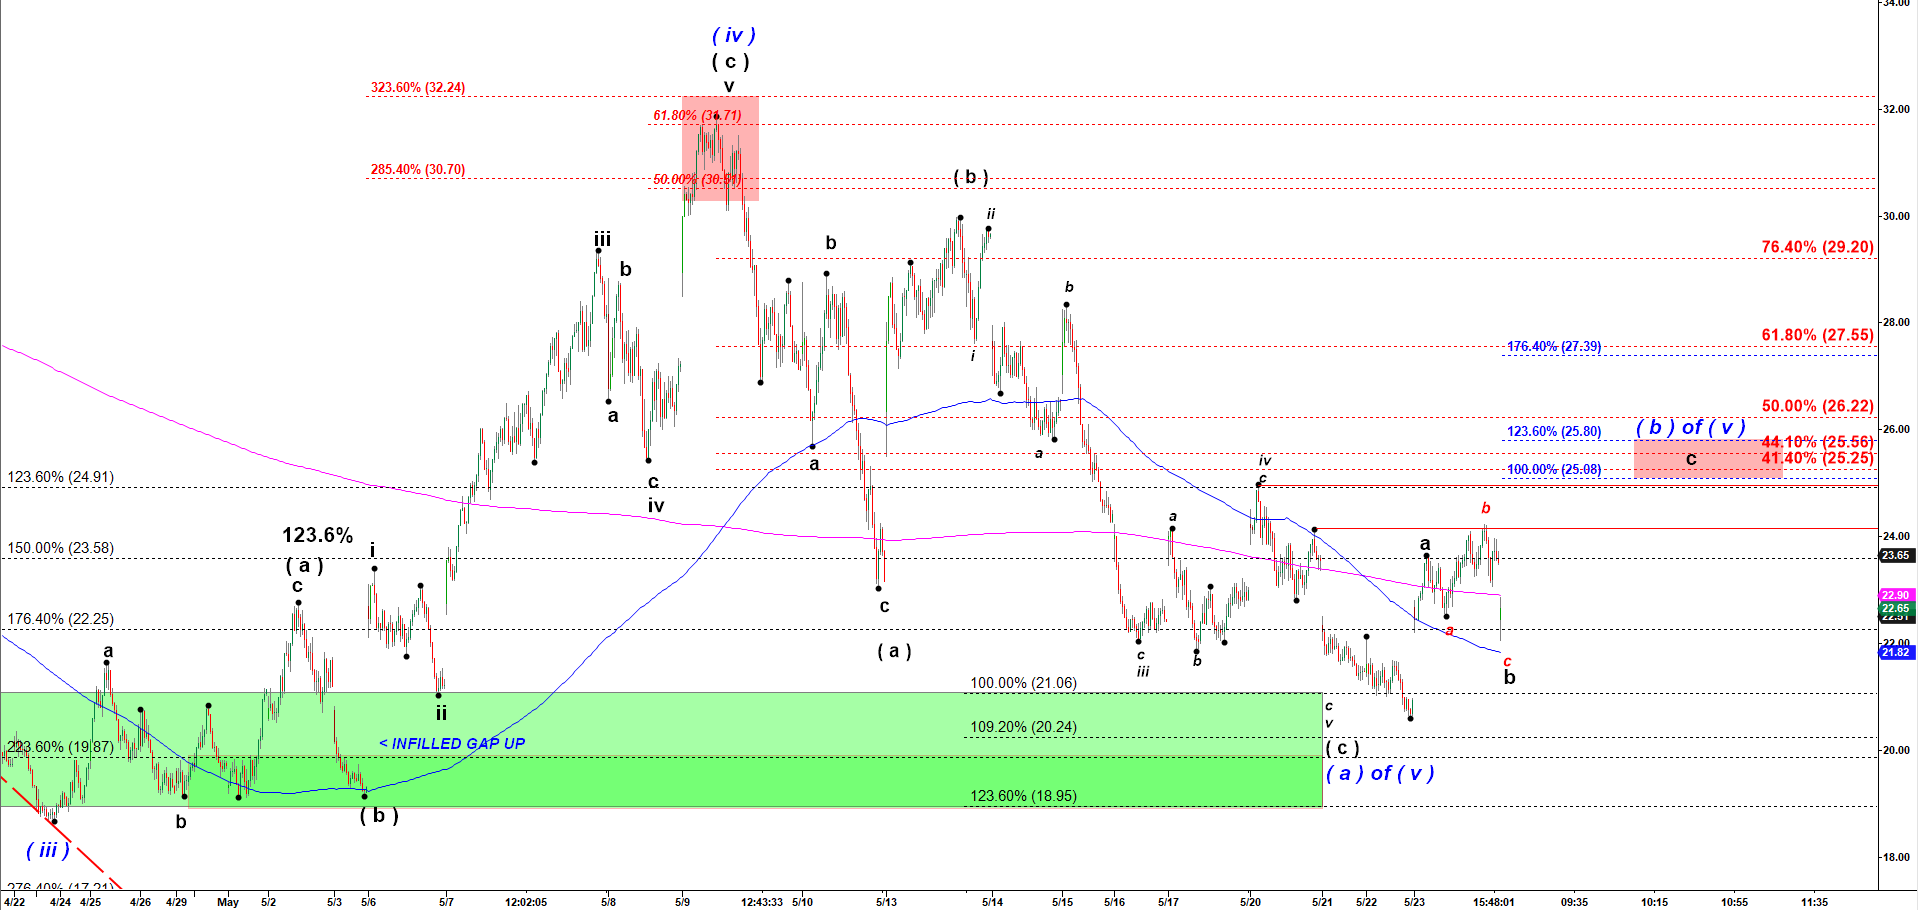
TVIX - we have got an expected wave b down
We have got wave b down, as predicted yesterday.
Please note that this b down is structured as an expanded flat structure where a corrective subwave b up managed to make a higher high over the top of wave a up.
From here we may get another rally in TVIX targeting 25-25.80 in wave c up. That would complete a corrective wave ( b ) up and set a stage for another strong decline in TVIX in wave ( c ) down targeting new All Time Low.
TVIX - 120 min chart updated at 9:05 AM on 5/24/2019
Previous posts:
No posts found.