Below you can read a report that I sent to my subscribers at 3:20 PM on Tuesday, May 22nd, 2019. In the report I warned them about coming spike in volatility. Moreover, I showed them a BUY Zone under 21.06. The following day TVIX bottomed at $20.60. And this morning it spiked by 11% to $23.60:
Folks I want to show a potential bullish setup for volatility.
Off the low we made at 18.67 on 23 April 2019 we have got an a-b-c up pullback.
There could be two options to count that pullback. The first one, hat a-b-c up was all of the correction. But we have the same problem. It was shallow if to compare to the magnitude of the whole decline off December 2018 low.
TVIX - 120 min chart updated at 3:20 PM on 5/21/2019
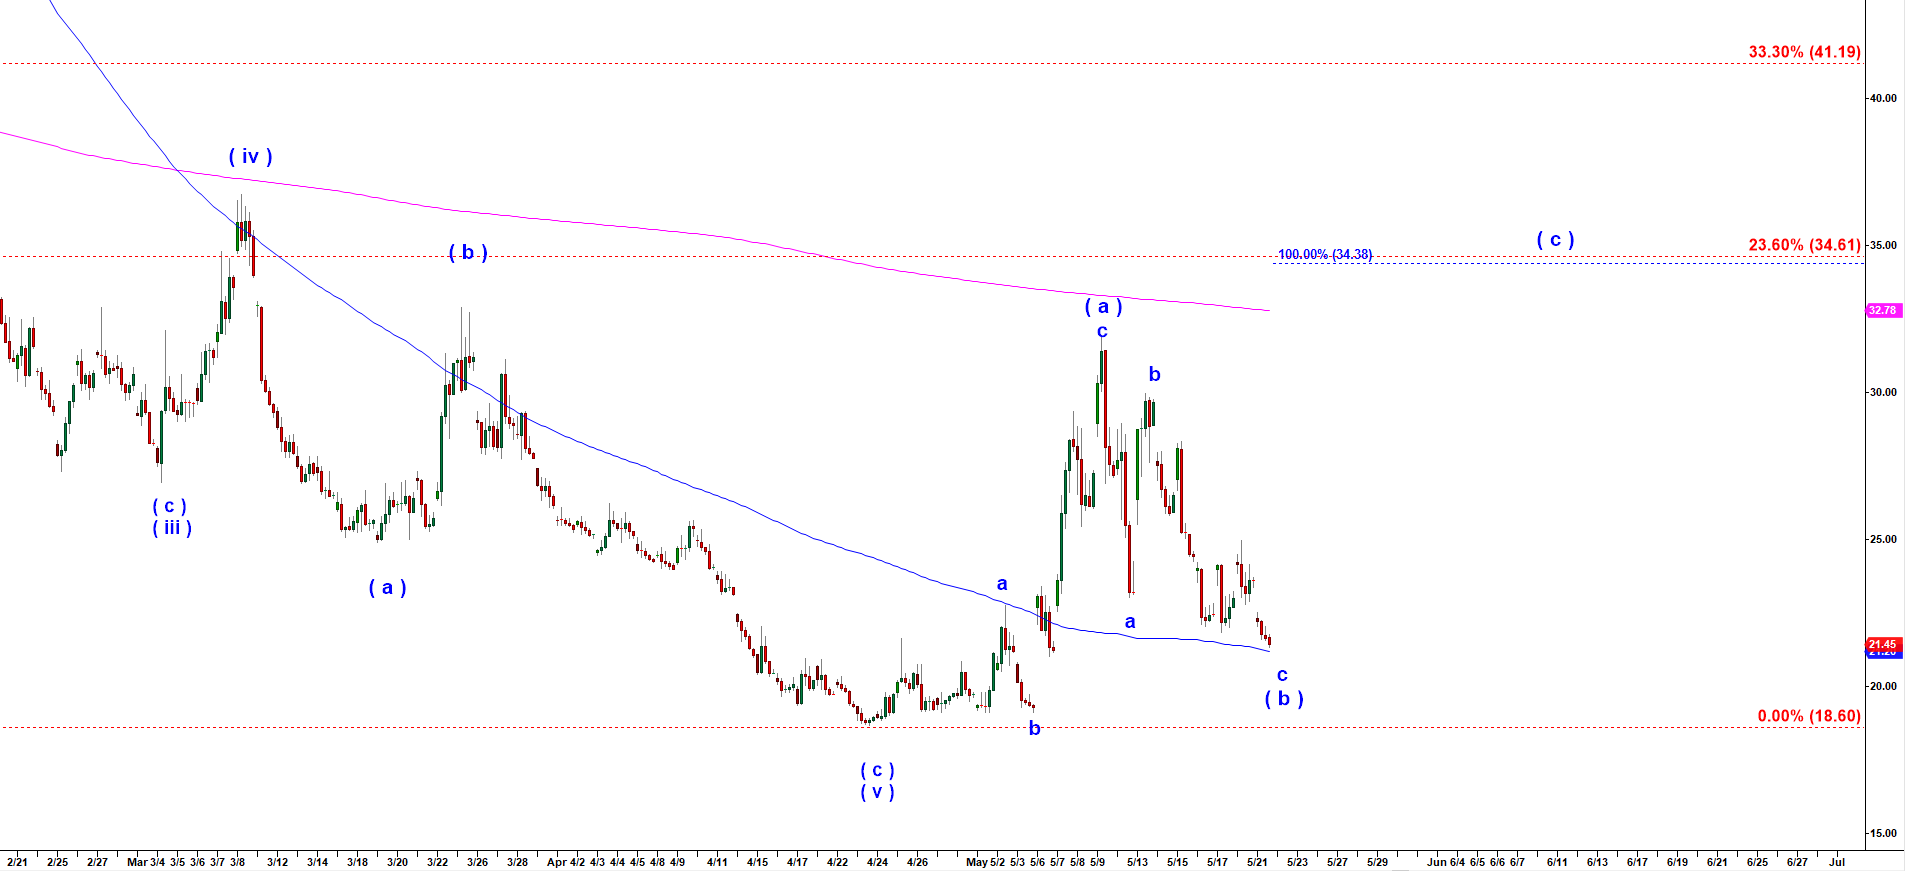
However, there is another potential setup where the a-b-c move up that topped at 31.86 on 9 May 2019 was only the first leg up in wave A. The vast majority of corrective waves start with a countertrend a-b-c move.
Off that top we have got a clean a-b-c down decline which looks really good to be wave b down. That sets up a stage for another move up in wave c up. And that final wave c up has to have an impulsive structure. At minimum it should target 100% extension of the rally into May top (100% = 34.60 ).
Look how TVIX is approaching 200 MA from above. I am sure many traders watch that bullish wedge.
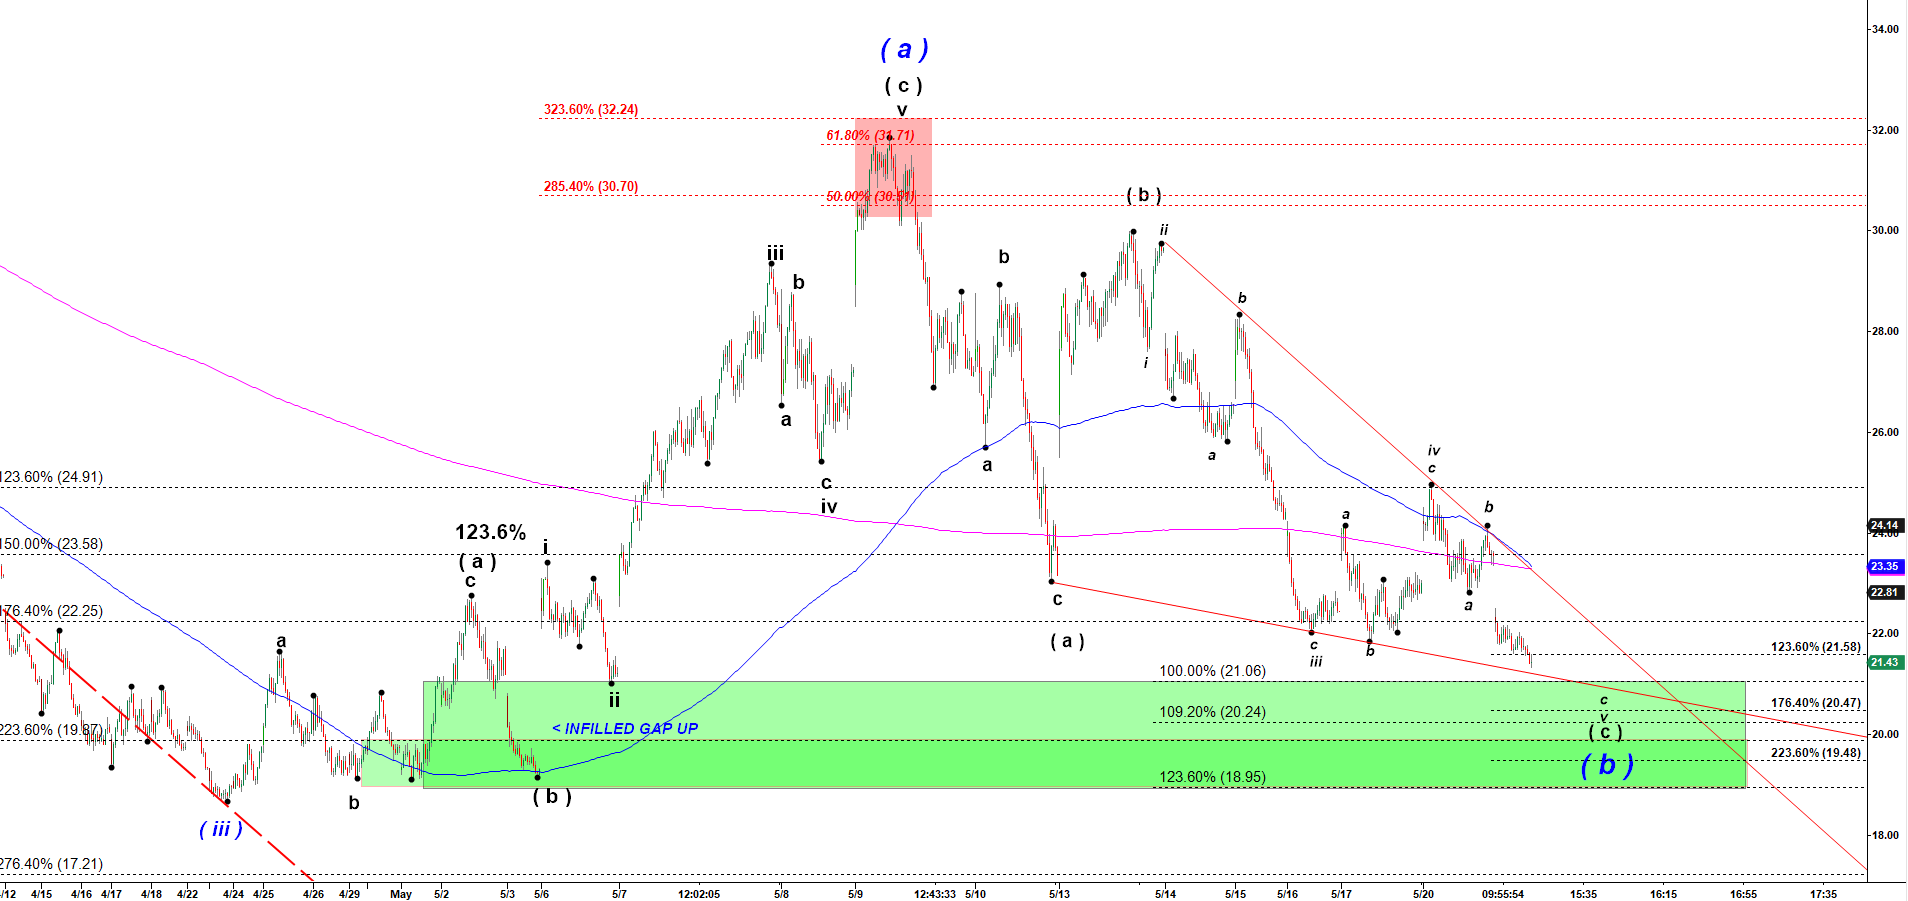
Now lets look at the micro picture ( chart below) . At this point we have a fully completed structure of that a-b-c down decline. It can complete any second. But at the same time it can extend lower into the green target box.
I will keep watching and hope it will tag 21.06 fib below.
TVIX - 3,000 tick bar chart updated at 3:20 PM on 5/21/2019