Subscription: Access to Micro Counts of US indices
TVIX - followed the alternative bullish red count
Yesterday I posted a chart of TVIX with two alternative counts. I mentioned that the black count is the primary one and it did look bearish. Conversely, the red alternative bullish count had a lower probability. However, TVIX chose to follow the red bullish count.
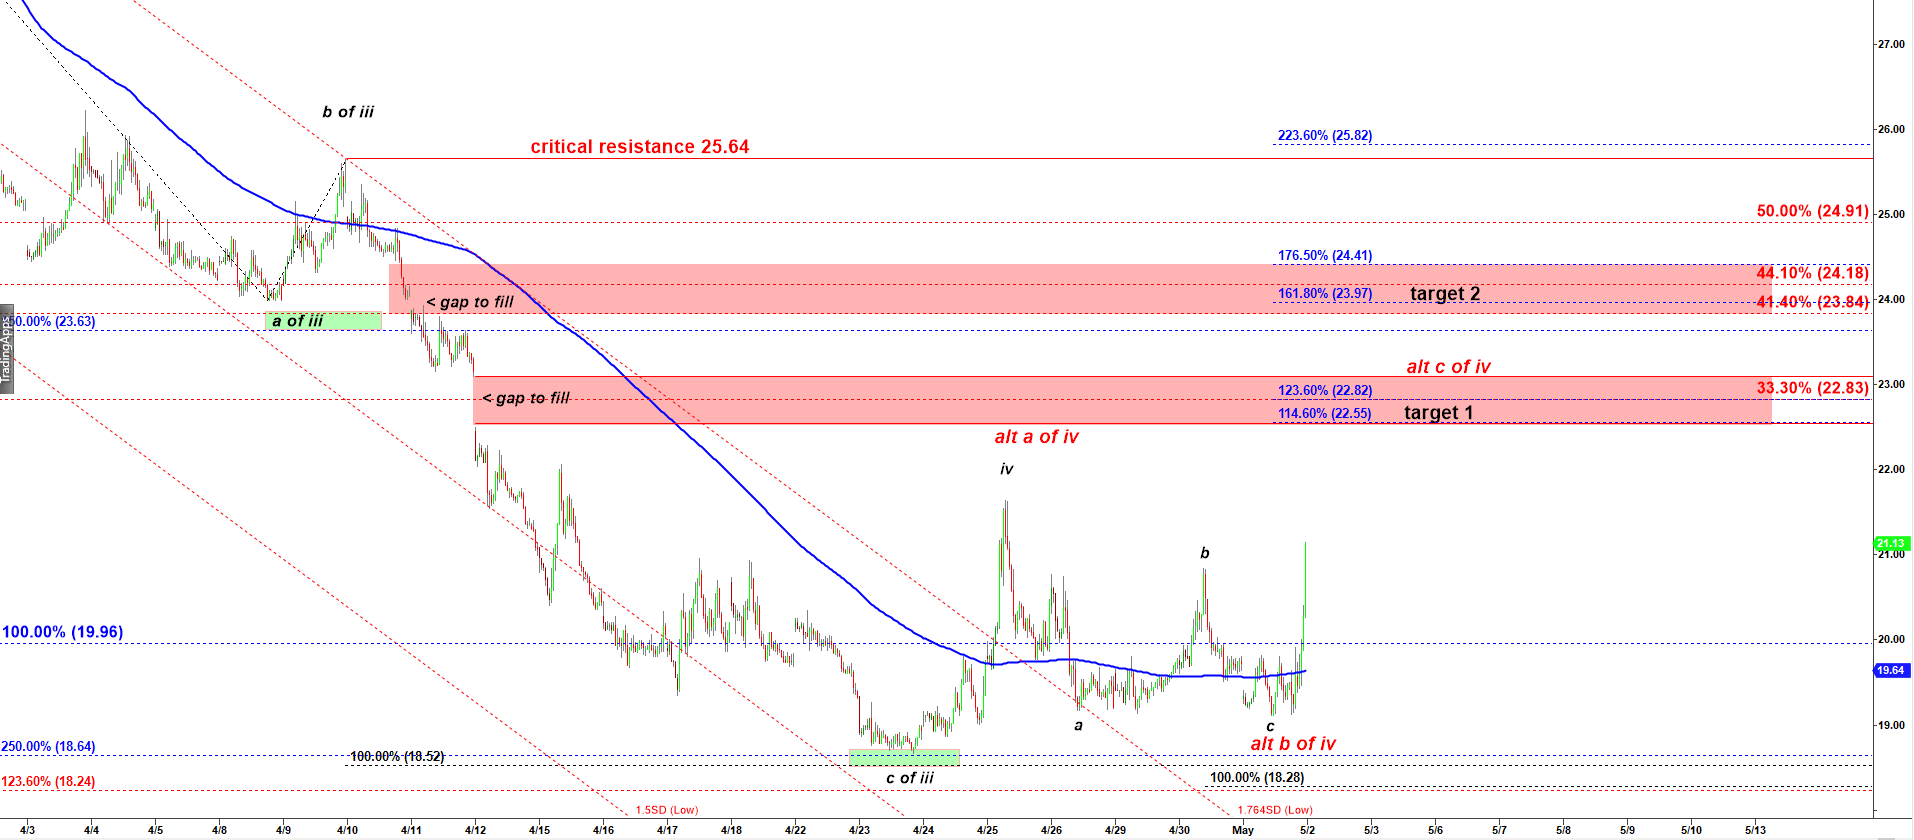
That scenario counts the structure of the low made at 18.57 on 23 Apr 2019 as a corrective wave iv up.
That wave iv up could be subdivided as a-b-c up where waves a and b were themselves subdivided into three smaller subwaves (see the red labels).
However, the final wave c up has to have an impulsive structure and has to be subdivided into five waves up. We should count that wave c up (red label) off the low at 19.11 made at noon on May 1st, 2019. That bullish scenario implies that the rally may move higher into the two red target areas on the chart. The problem here is the same. The micro count of that spike today is not clean. Therefore I am not going to trade TVIX at this point…
TVIX - 15 min chart updated at 11:32 PM on 5/1/2019