Subscription: Access to Micro Counts of US indices
TVIX - does not confirm a top in S&P
Let’s start from 2 hour chart of TVIX to see the whole structure of ongoing decline off Dec 2018 top. Again, we need to get full five waves down off Dec 2018 top.
My count suggests that we have not bottomed yet in wave 3 down. As you can see on the chart below there are two areas with confluence of fibs:
23.60-23.55 and 18.40 – 17.80. Now let’s check a micro chart of TVIX ( 15 min ) (please scroll down).
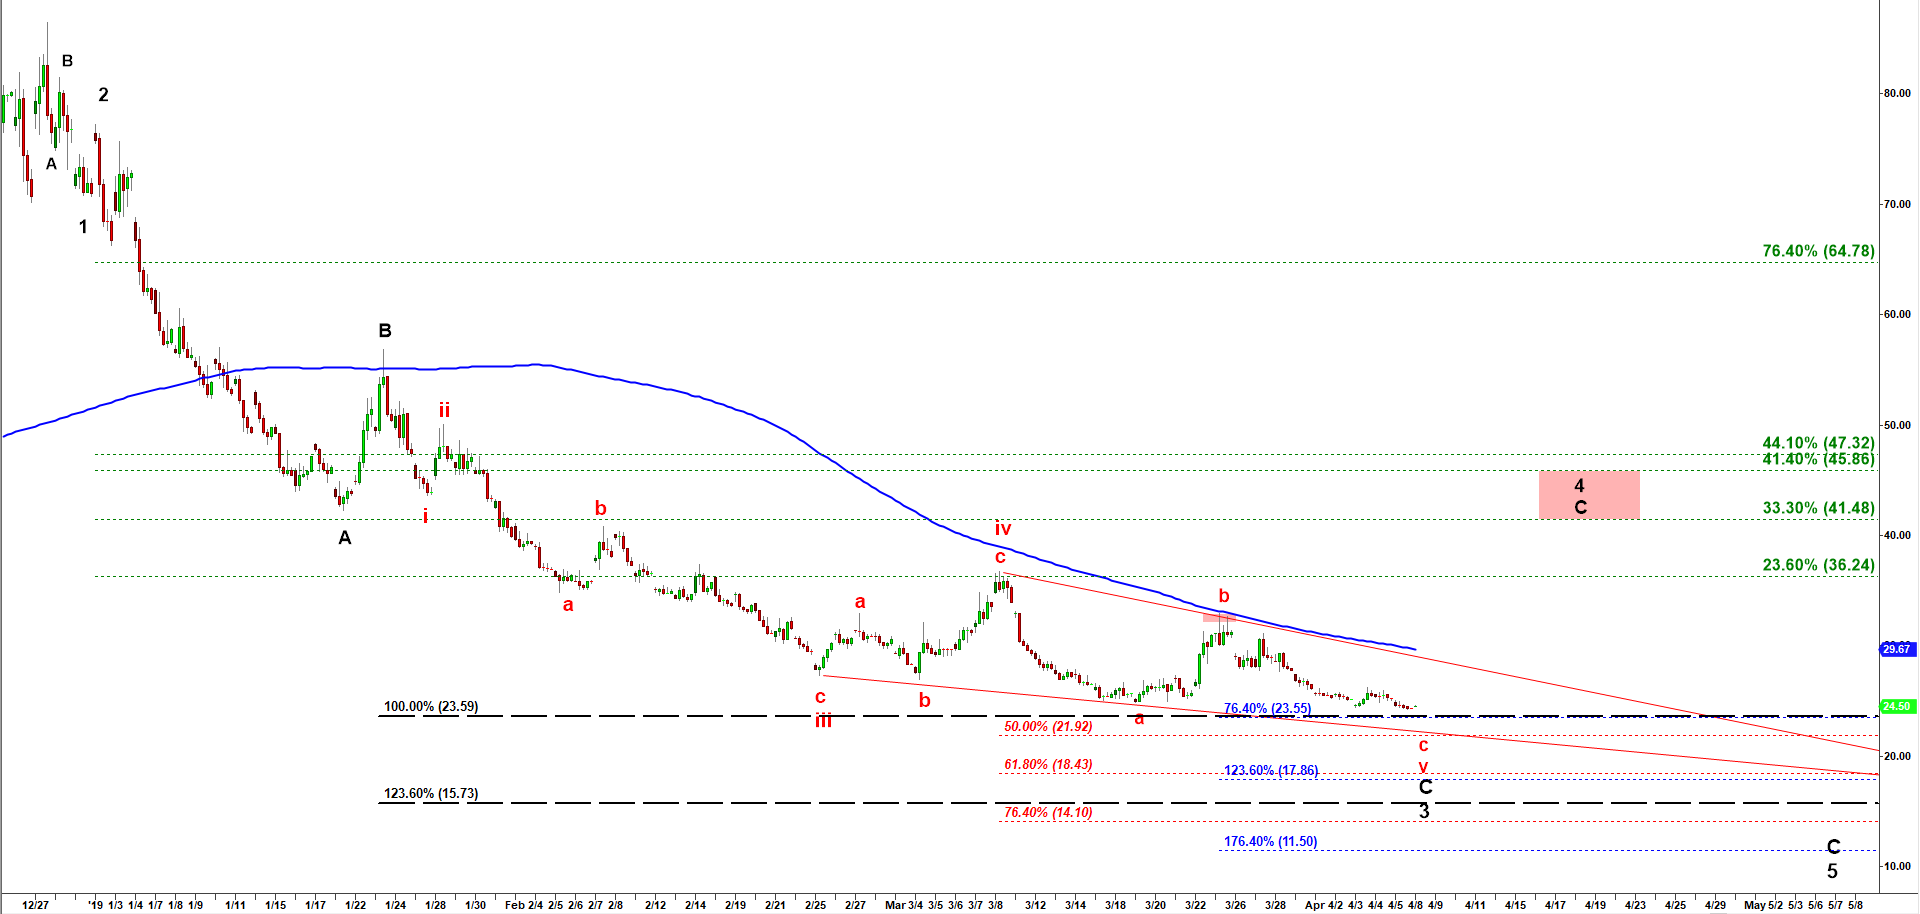
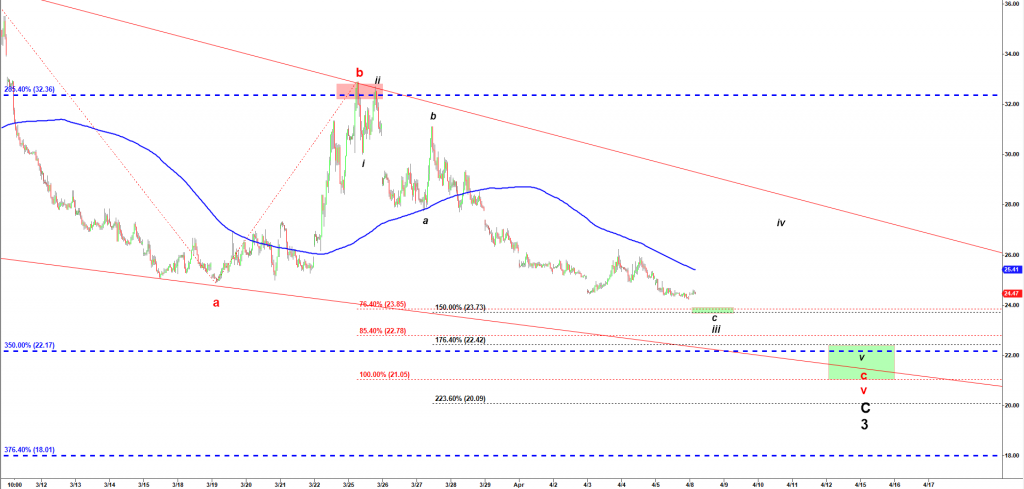
To complete wave 3 down off Dec 2018 top we need to complete the red wave c of v. But looking at the micro structure of that red wave c of v ( the red labels) we see that even black micro wave iii down might not have completed at this point. That 23.70-23.50 area may be a bottom for that black micro wave c of iii. Then we may get a pullback in micro iv up and it could be as shallow as 25.90
and only then we would get a micro wave v down that would complete the red wave v and consequently the black wave C of 3 of a larger degree.
TVIX - 15 min chart updated at 9:40 AM on 4/8/2019
