Subscription: Access to Micro Counts of US indices
TVIX - there is uncertainty whether the bottom of wave 3 is in
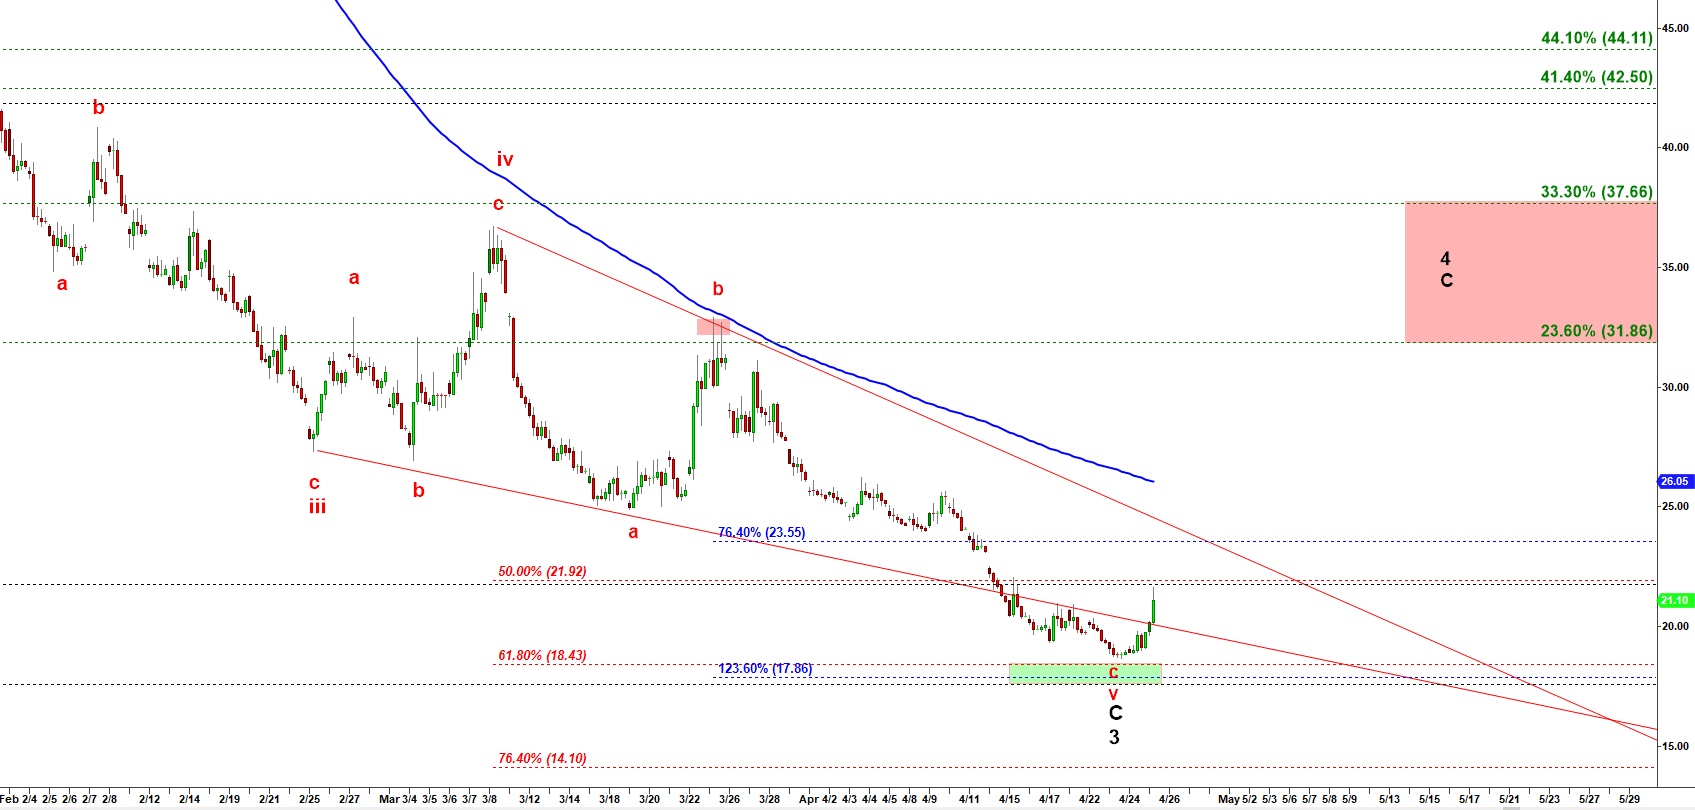
If we zoom-out to 120 min chart we can see that wave c of v (red labels) look pretty much completed. That scenario implies the strongest part of decline of volatility in wave 3 down (in impulsive downside structure off Dec 2018 top) has completed. Then we may expect that this spike up has legs and it can keep going up to the Red Target box.
TVIX - 120 min chart updated at 11:00 AM on 4/25/2019
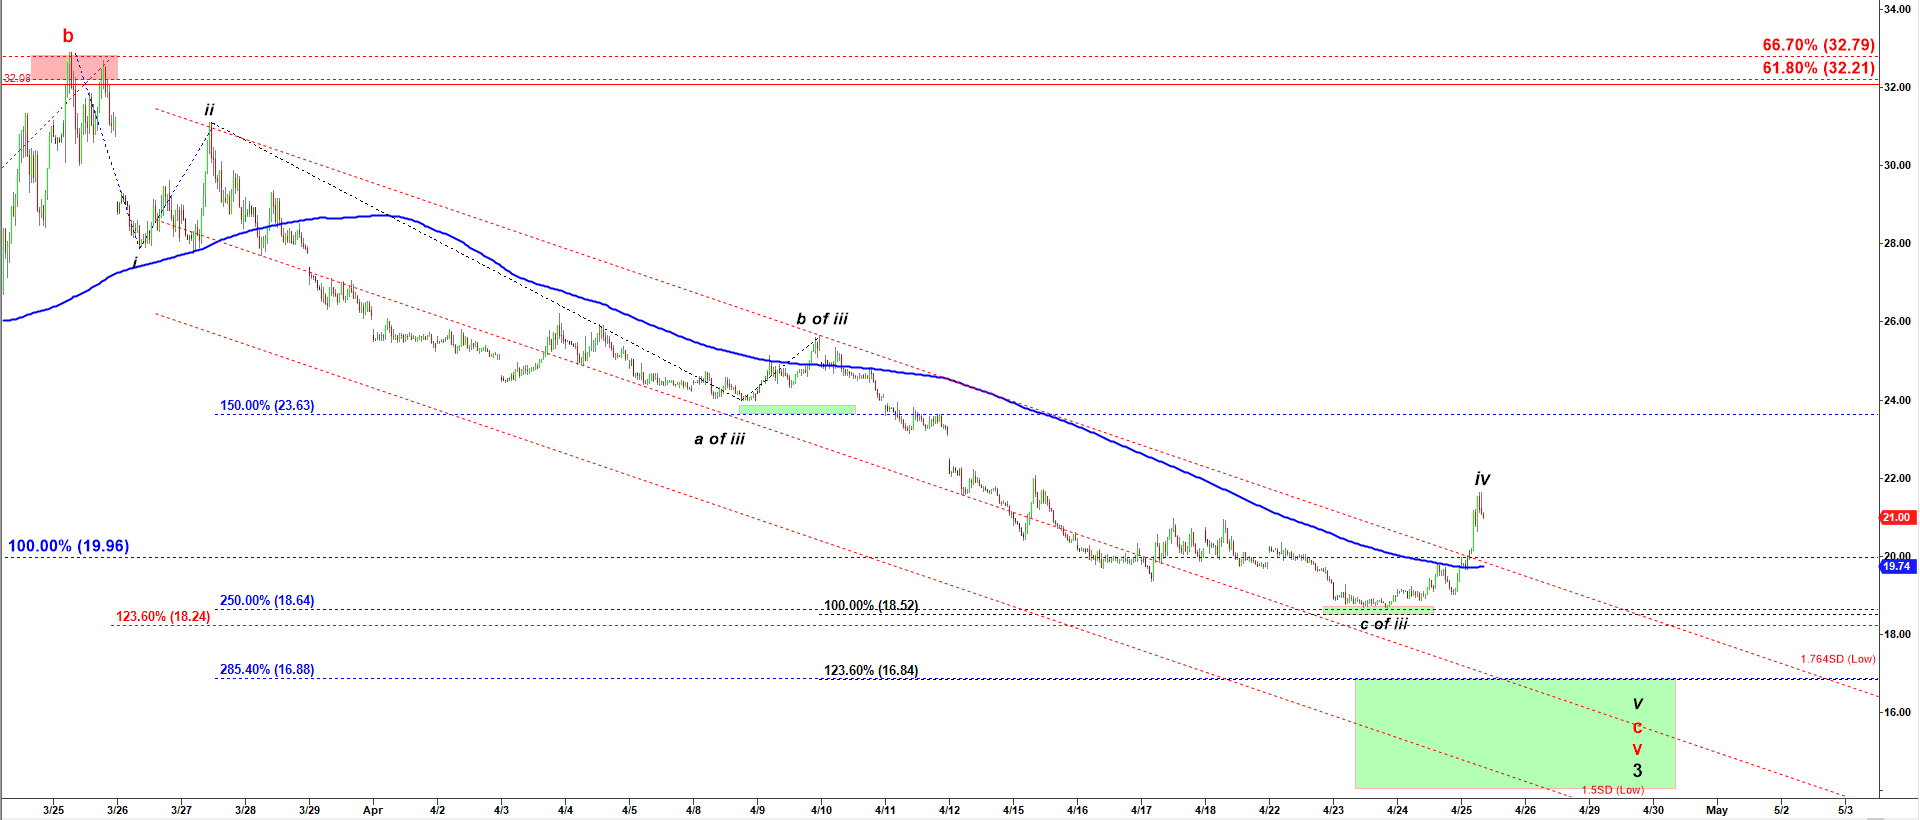
However, if we zoom-in to 15 min chart we may see that the micro structure of the wave c of v (red labels) does not look complete. Specifically, this spike ideal fr micro wave iv up. That scenario implies another dump in volatility to one more low in wave v down (black labels in italic font). I will be waiting for one more low to go long volatility.
TVIX - 15 min chart updated at 11:00 AM on 4/25/2019