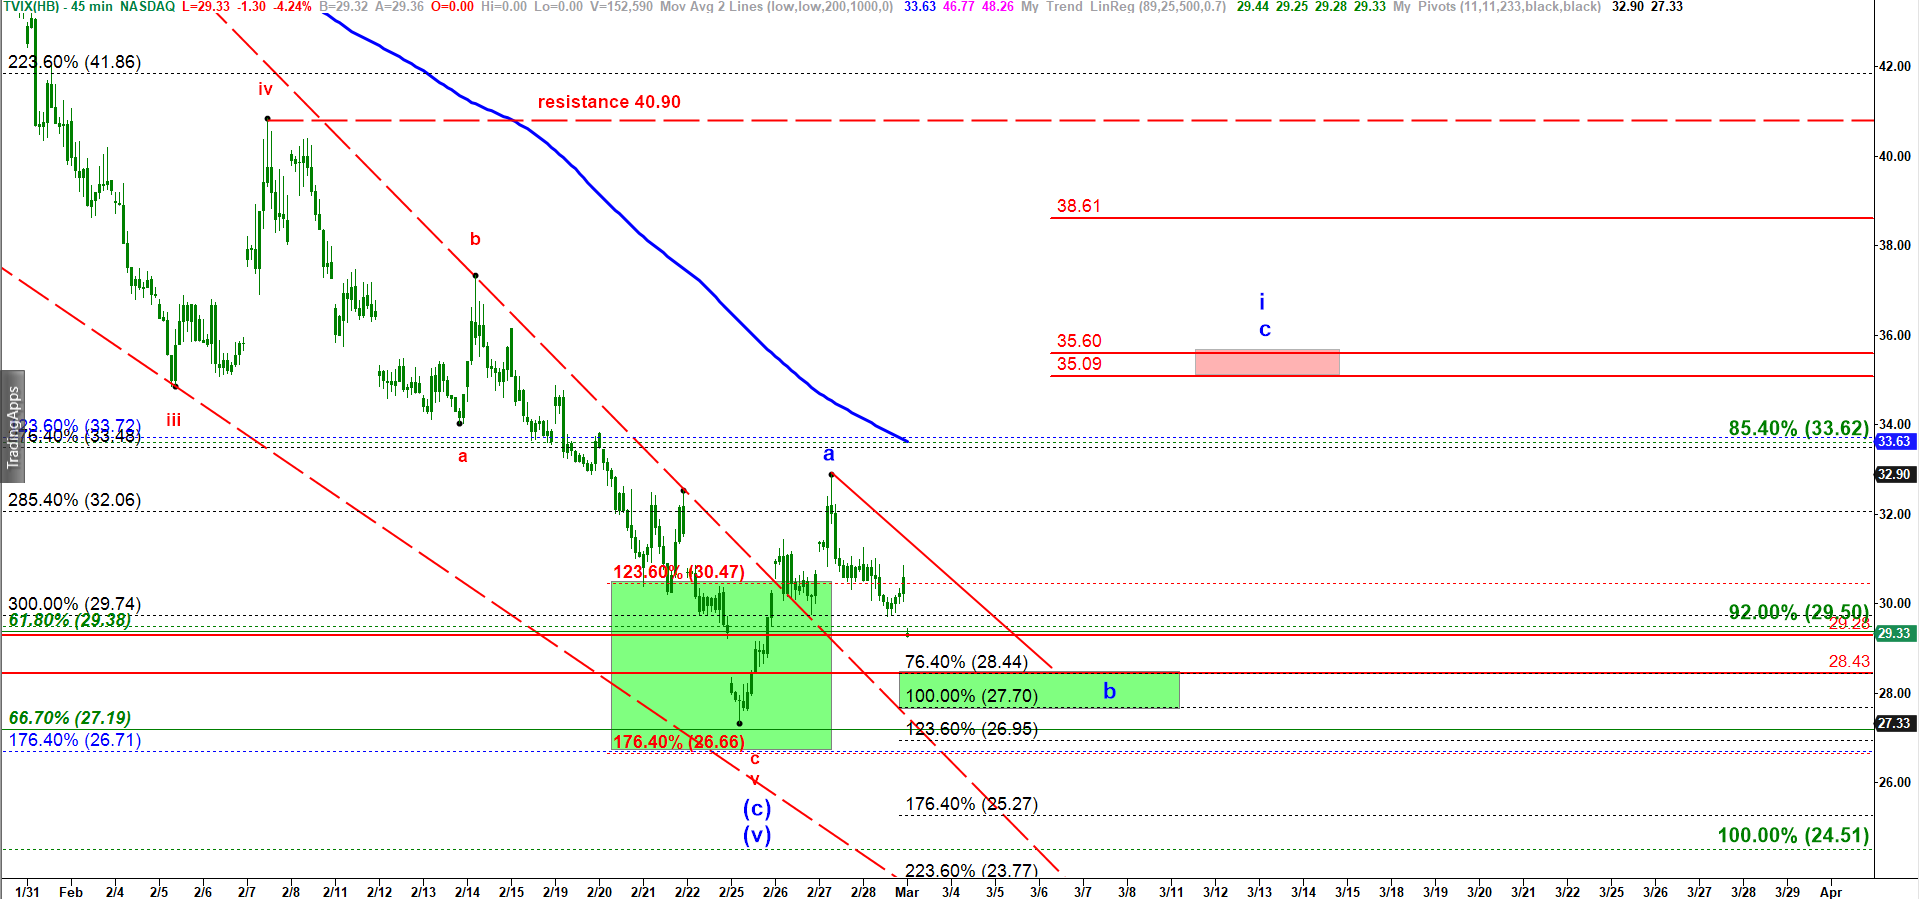
TVIX - correcting in wave b down after the first leg upoff the bottom
On 25 February 2019 I correctly identified a morning gap as an exhaustion gap that completed a five wave down fractal off the December 2018 top in volatility.
Off that low I expected a corrective a-b-c move up in volatility. So far we have got our wave a up. And we have been in a corrective wave b down. Again and again I will be repeating that waves b are the worst enemies of traders. Especially those that are inside corrective structures. That b may stretch lower even to make a new lower low under the 27.33 low we saw this Monday. But that would be a normal case? Well, that b down should look corrective and structured as micro a-b-c. And c should at least stretch to 76.4% of the first drop, but may get to 100% or 123.6% extension. That gives us three targets for completion of that b down: 28.44, 27.70 and 26.95. Frankly, I like a scenario where TVIX would bottom at 28.60 – 28.45. Because 28.60 is 76.4% retracement of the first rally inn wave a up off the bottom. And second, its the lower boundary of the gap down happened on 25 Feb 2019.
TVIX - 15 min chart updated on 1 March 2019