TVIX - has enough waves to complete down structure off the December 2018 top
TVIX is VelocityShares Daily 2x VIX Short-Term ETN, an exchange-traded-note (ETN) that tracks an index of futures contracts on the Standard & Poor’s 500 (S&P 500) VIX Short-Term Futures Index, with 200% leverage on the volatility moves.
In my update posted on 14 February 2019 I correctly predicted that the spike in volatility on 14 February 2019 was only a temporary bullish pullback. Let me repeat what I wrote back then:
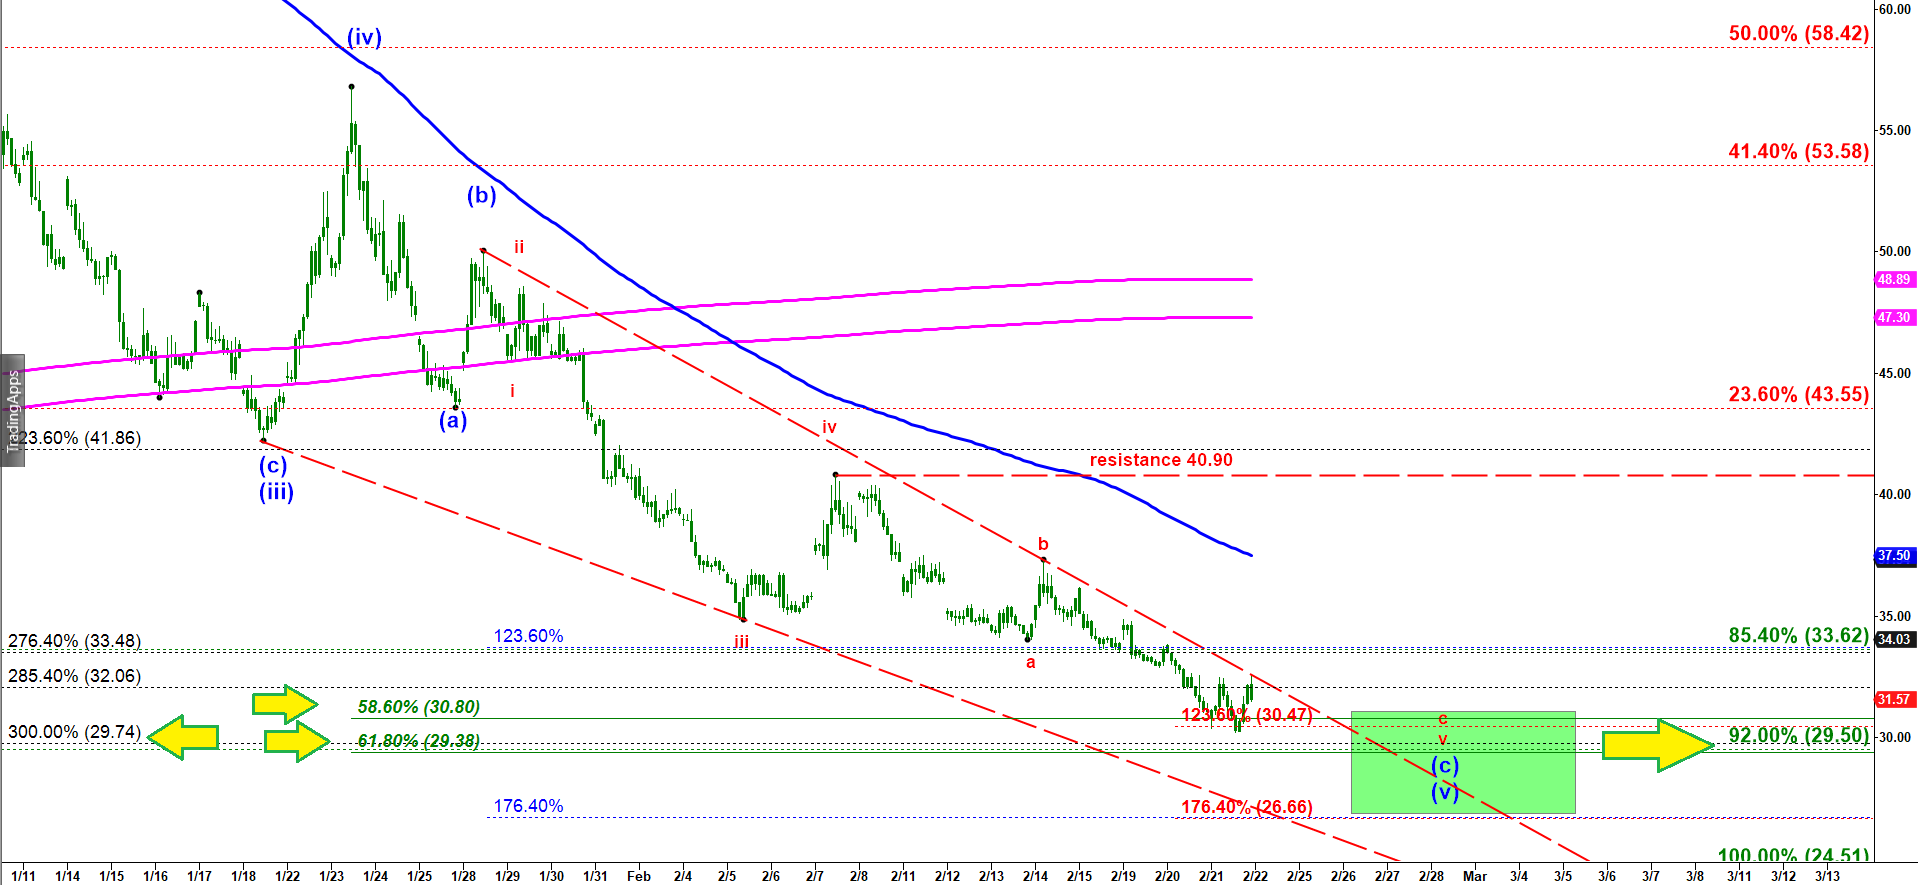
“As long as that spike stays under the critical resistance of $40.90 we should get the very final move down in micro wave c of v that would complete the whole five wave down structure and may set up a bullish pullback in volatility and a larger corrective move down in the market. The ideal target for the bottom is under $30.00”.
So far TVIX has made the lowest low at 30.20. By the way, TVIX was at $36.40 when I predicted that drop to $30. Now if we look at a micro structure of that final wave (c) of ( v ) we will see a perfectly completed structure.
We have got the final micro wave c of v = 123.6% of wave a of v (red labels). We still have a pretty tight confluence of fibs at 29.75-29.50-29.40. Can TVIX make one more low and stretch to that target? Sure, it can. But it has arrived into my green target box in a very completed macro and micro structure and every new move lower would make me buying calls on TVIX.
TVIX - 15 min chart updated on 21 February 2019