TVIX - the down structure does not look complete
In my previous update posted on 14 February 2019 I correctly predicted that the spike in volatility on 14 February 2019 was only a temporary bullish pullback. I can only repeat what I wrote back then:
“As long as that spike stays under the critical resistance of $40.90 we should get the very final move down in micro wave c of v that would complete the whole five wave down structure and may set up a bullish pullback in volatility and a larger corrective move down in the market. The ideal target for the bottom is under $30.00”.
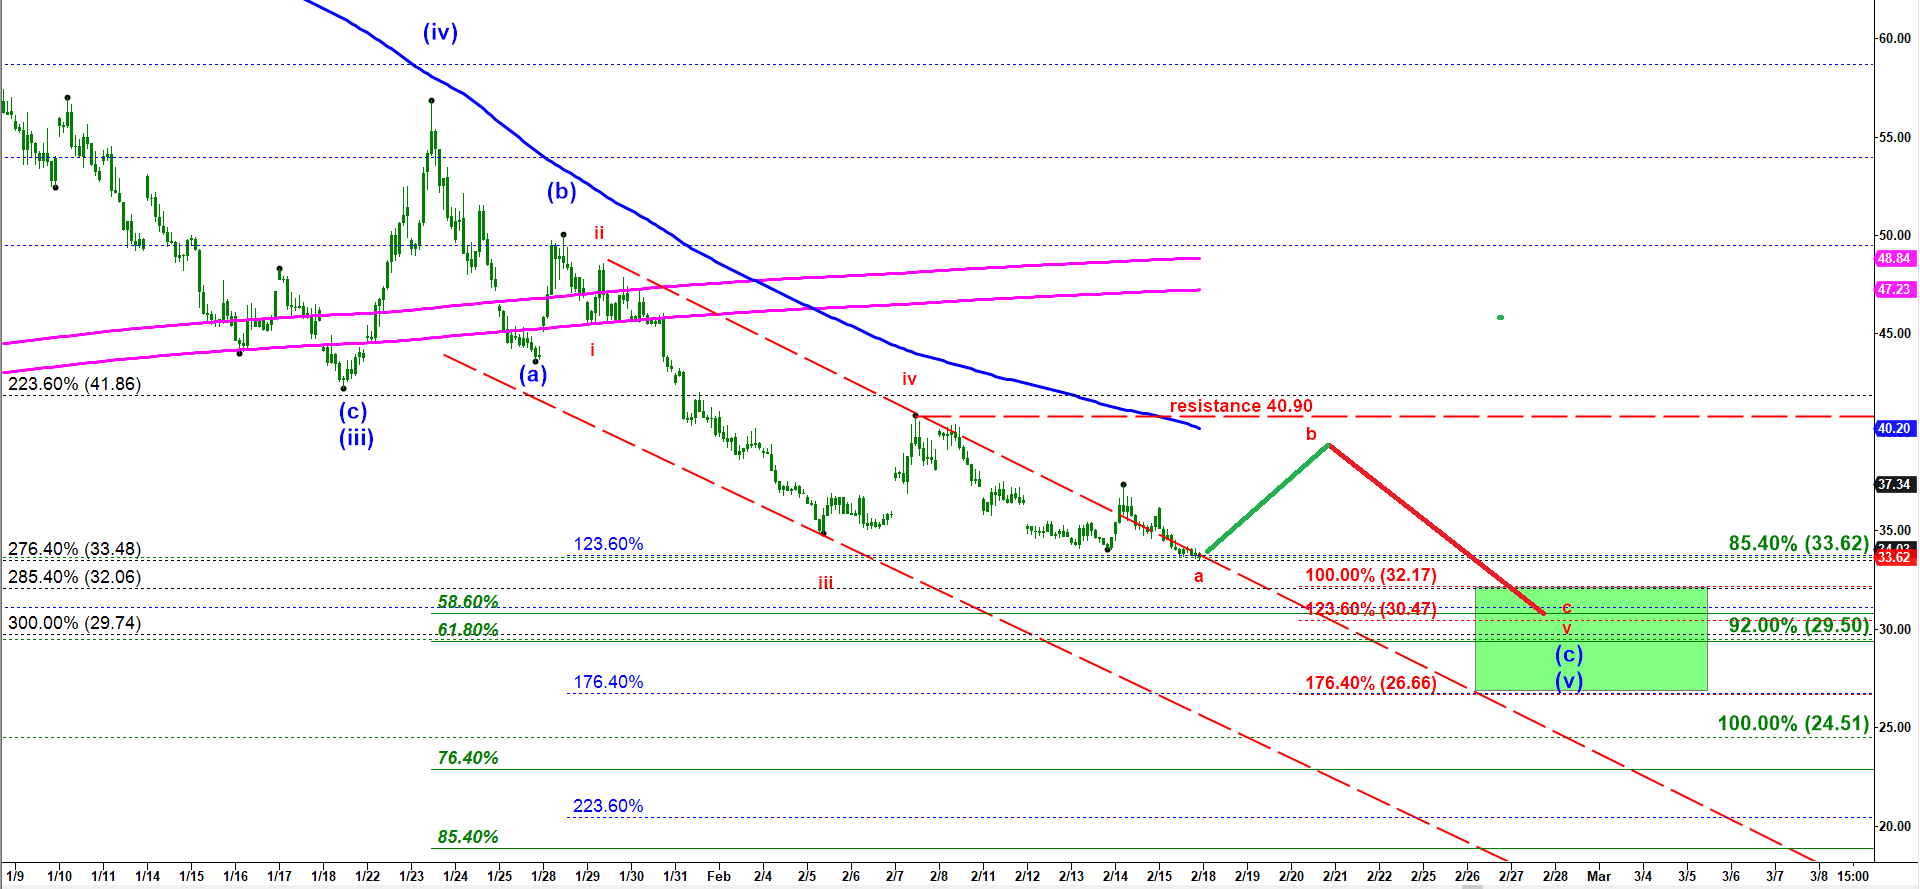
The very next day on Friday TVIX dropped 6% to a new lower low. We currently have two alternative micro scenarios. If you click to enlarge the right chart below you will see a bullish micro alternative. The low made on Friday could be a bottom of wave a of v down. And we may get a spike in volatility in wave b of v this coming Tuesday. But as long as that spike holds under the critical resistance at 40.90 it would be only a temporary pullback before the final move down targeting $30.00.
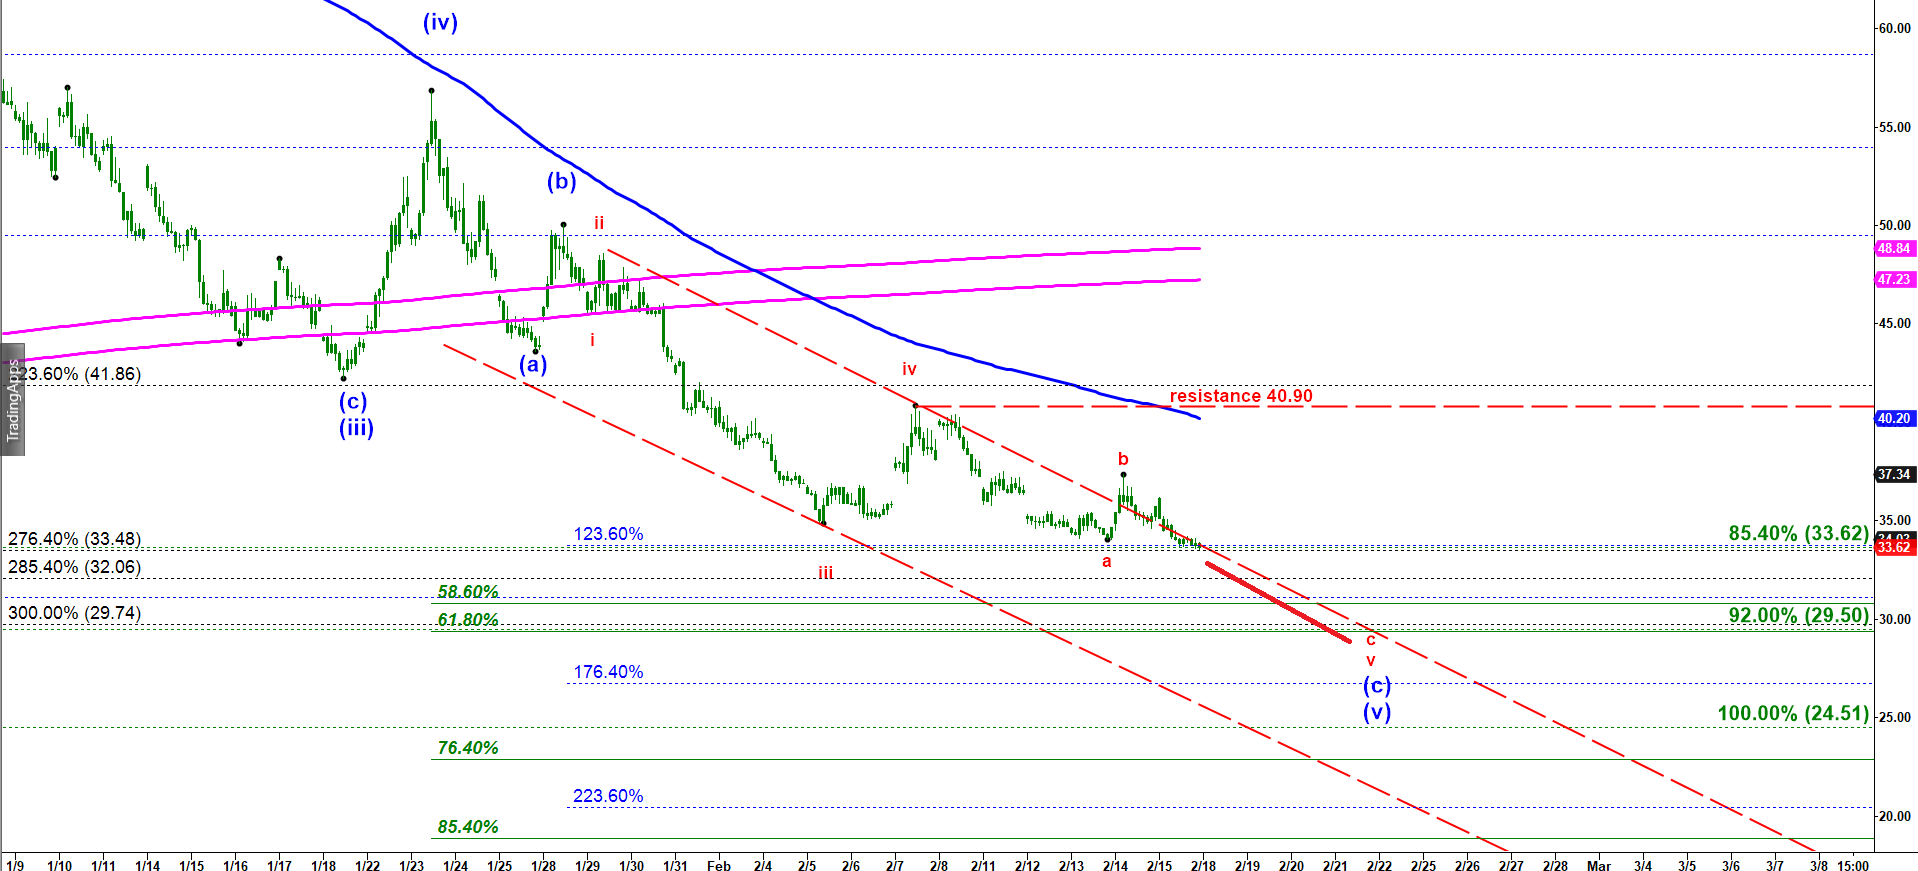
The bearish scenario (click the left chart below ) assumes that spike in volatility on 14 Feb 2019 was that corrective shallow wave b up and we are in the final wave c of v down. That scenario has the very same target for the bottom at or slightly under $30.00.
Bullish alternative count
Bearish alternative count