• Home
  • Free Updates
    • Nailed!
    • Major US Indices
    • Gold & Silver
    • Crude Oil & Natural Gas
    • US stocks
  • UPDATES
    • Subscribe now!
    • US Stock Indices
    • Gold, Silver and GDX
    • Crude Oil & Natural Gas
    • Value and Momentum Stocks
  • Education
    • Beginners Video Course
    • Intermediate Video Course
      • Syllabus of the Course
    • Trading Like A Pro Video Course
    • Video Lesson of the Week
  • Blog
  • Chat Room
  • Pricing
  • FAQ
Menu
  • Home
  • Free Updates
    • Nailed!
    • Major US Indices
    • Gold & Silver
    • Crude Oil & Natural Gas
    • US stocks
  • UPDATES
    • Subscribe now!
    • US Stock Indices
    • Gold, Silver and GDX
    • Crude Oil & Natural Gas
    • Value and Momentum Stocks
  • Education
    • Beginners Video Course
    • Intermediate Video Course
      • Syllabus of the Course
    • Trading Like A Pro Video Course
    • Video Lesson of the Week
  • Blog
  • Chat Room
  • Pricing
  • FAQ

TVIX - this spike is only a pullback in wave b up of v down

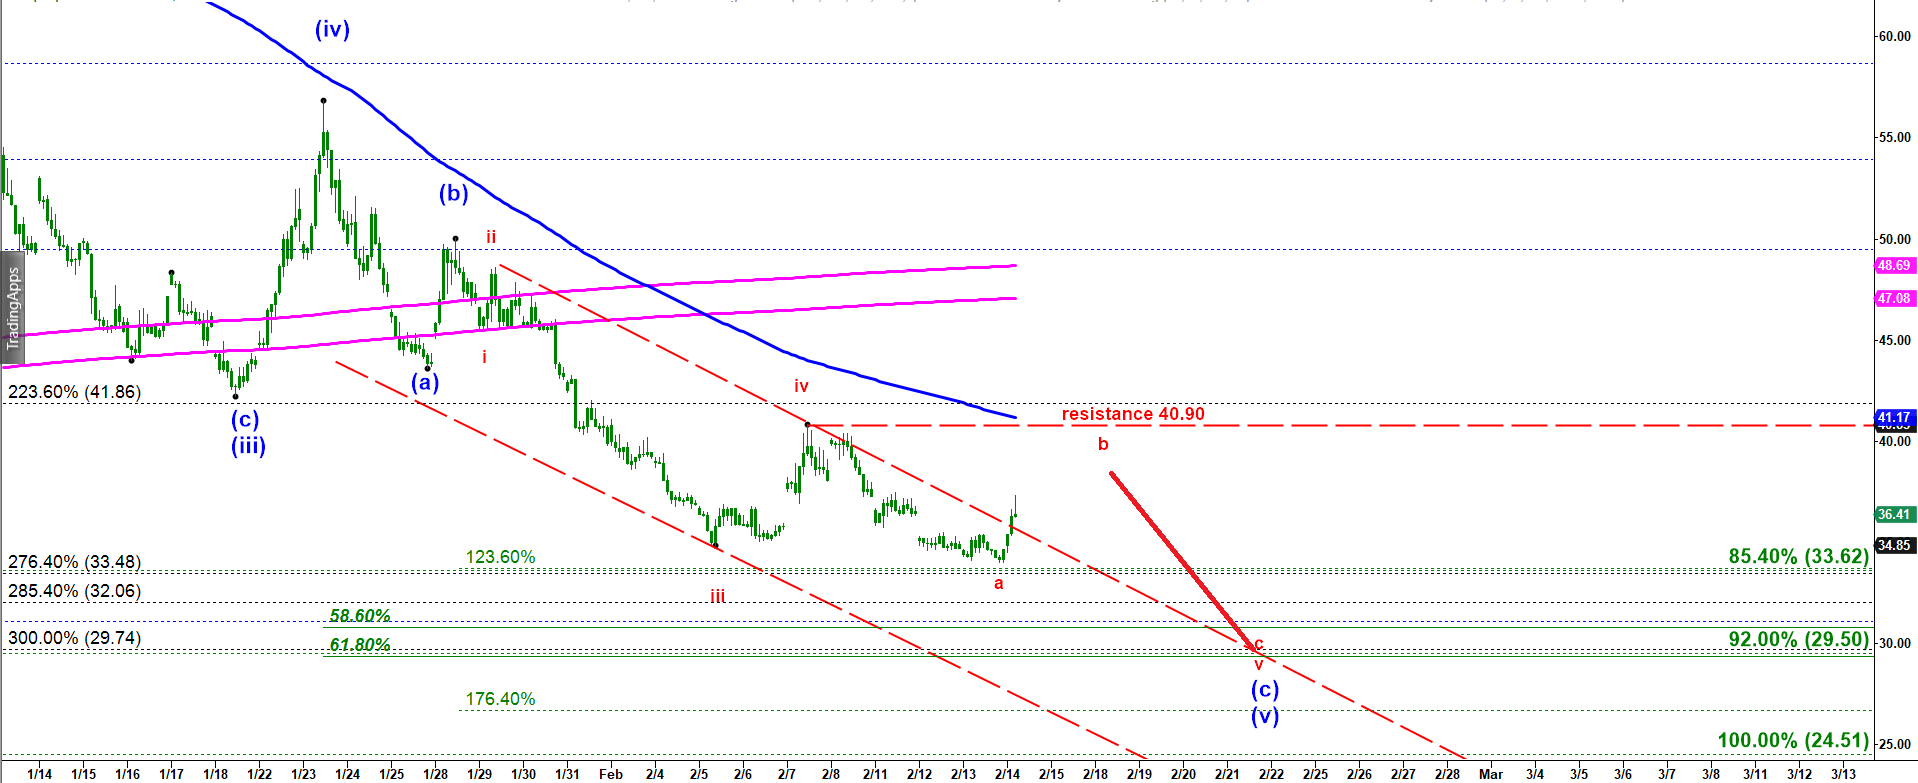
As I noted in my previous update, to bottom in an impulsive declining structure off the December 2018 top we need to get one more lower low in wave v of (c) of (v). That final micro wave v down should be structured as a-b-c. The first leg down in micro wave a bottomed yesterday at $34.04.

Now we are obviously watching a spike in volatility that should be counted as a corrective wave b up. As long as that spike stays under the critical resistance of $40.90 we should get the very final move down in micro wave c of v that would complete the whole five wave down structure and may set up a bullish pullback in volatility and a larger corrective move down in the market. The ideal target for the bottom is under $30.00

TVIX- 45 min chart updated on 14 February 2019

Start to learn how to predict the next market move today!
Check out my latest updates
  • My Account
  • Login
Hestia | Developed by ThemeIsle

Login

Lost your password?