Subscription: Access to Micro Counts of US indices
Count of $SPY and the whole thinking process about a potential reversal trade
If I look at SPY ETF I can see a slightly different picture from ES mini:
SPY - 90 min chart at 2:50 PM on 5/16/2019
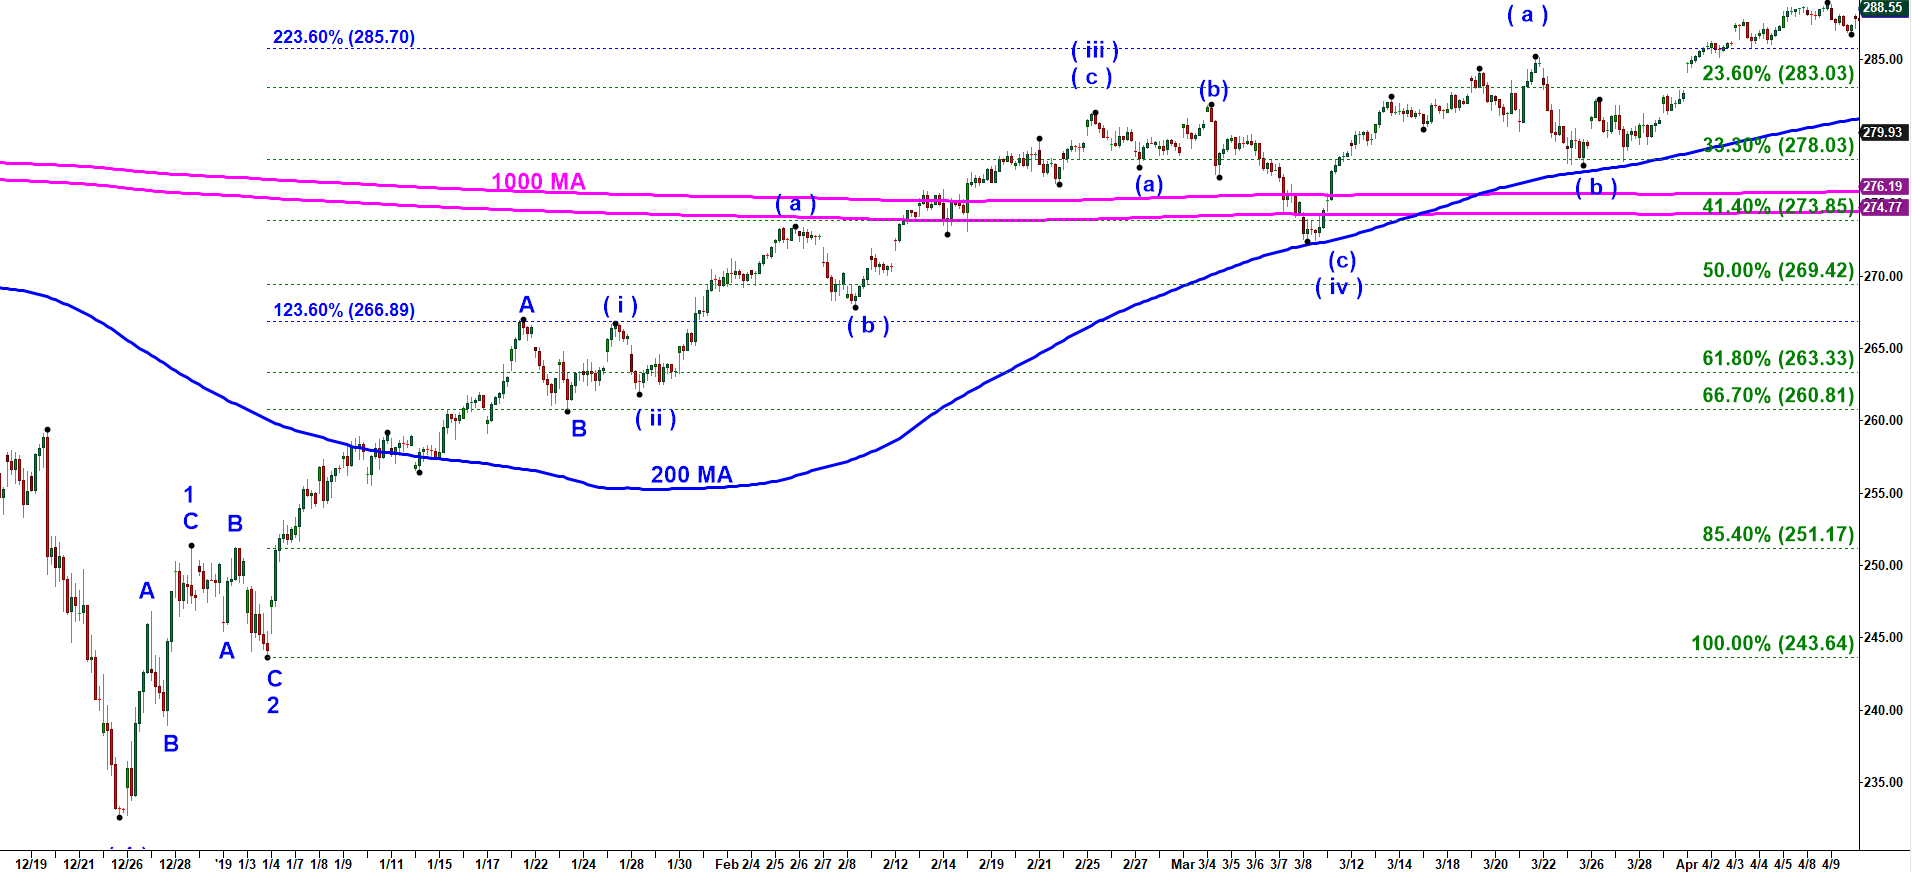
Above you see a start of the rally back in Dec 2018
and this is how the last segment of the rally looks like:
SPY - 90 min chart at 2:50 PM on 5/16/2019
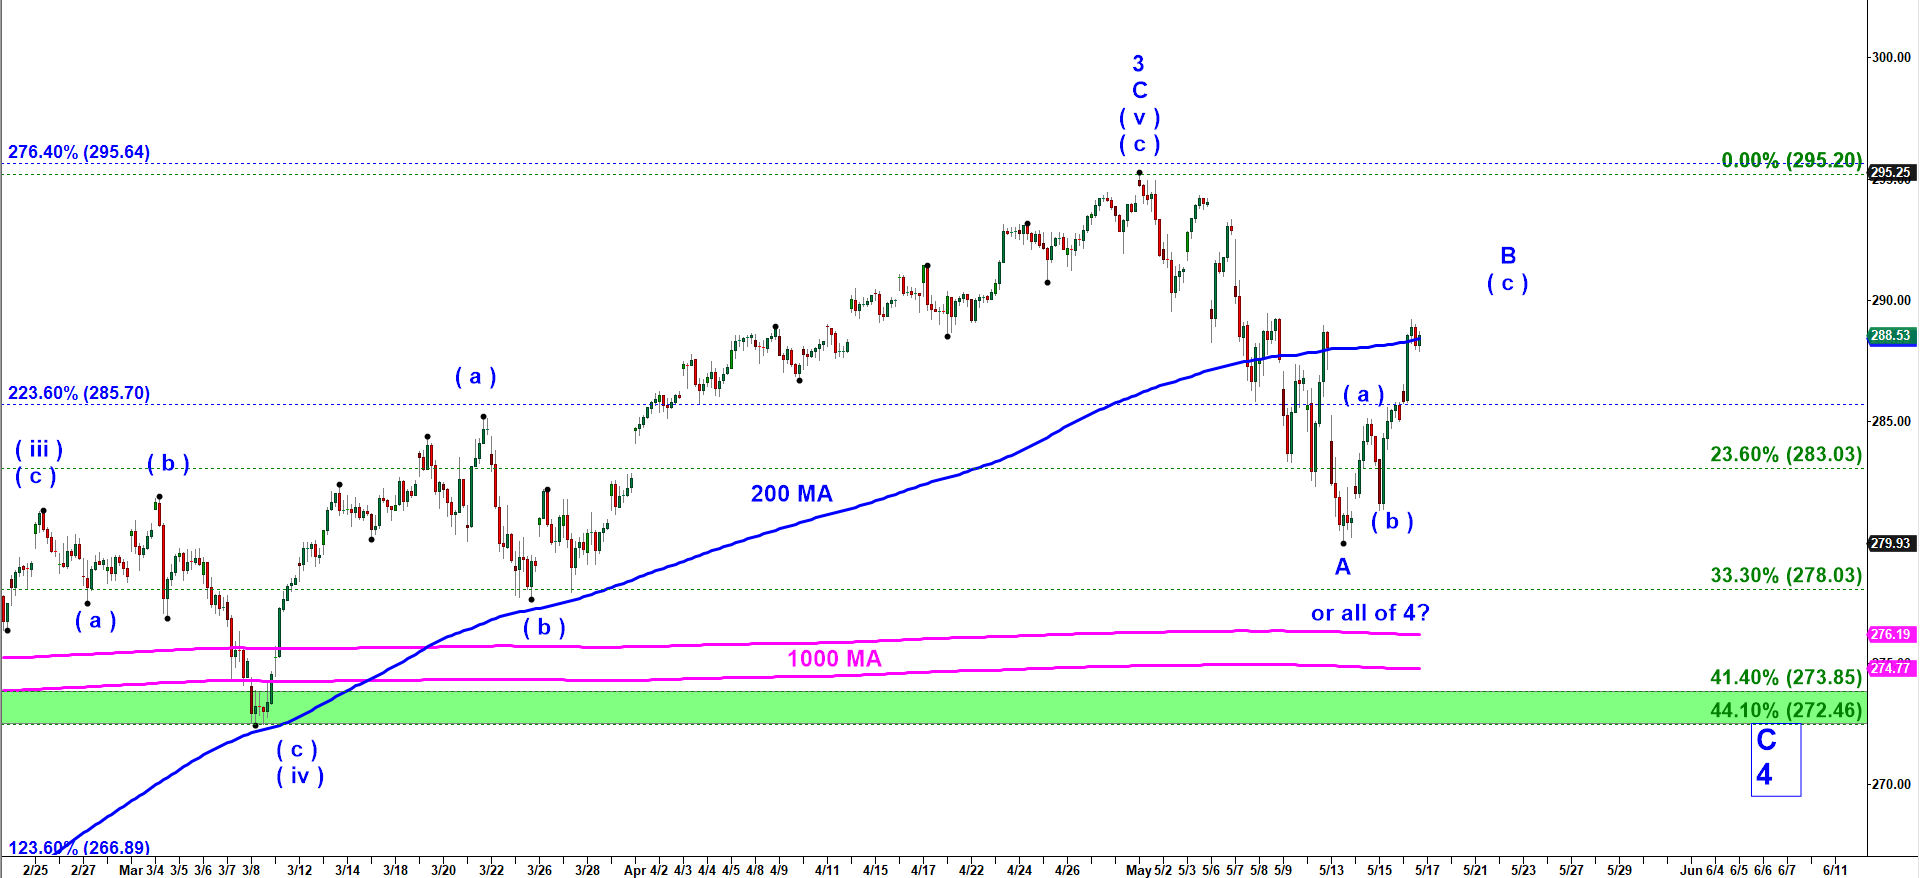
First, you can see that this structure does not look complete. And you may remember NQ, RTY and TVIX all do not look like complete five wave structures.
Second, the huge question is whether that drop off the May 1st top is all of wave 4 down or only the first leg down in wave A of 4.
I have several reasons to argue it was only wave A of 4:
– it tagged a minimum 23.6% retrecement fib but that is a typical fib for wave A, not for the whole wave 4 down;
– it tagged a low of wave ( b ) of ( v ) – atypical target for wave A of 4;
– a typical target for wave 4 is the low of preceding wave ( iv ) down of a lower degree (272.42).
Now, if we assume it was indeed only the first leg down in wave A of 4 down the next question is how high that corrective rally in wave B up may go.
First, we should expect some (a)-(b)-(c) corrective structure pointing up, which we do have..
Second, because wave B up is a corrective wave, it reacts to preceding drop in wave A down. That is why our main instrument is retracement fibs applied to the preceding drop.
This is how those retracement levels look like (red lines with red labels in the right part of the screen):
SPY - 90 min chart at 2:50 PM on 5/16/2019
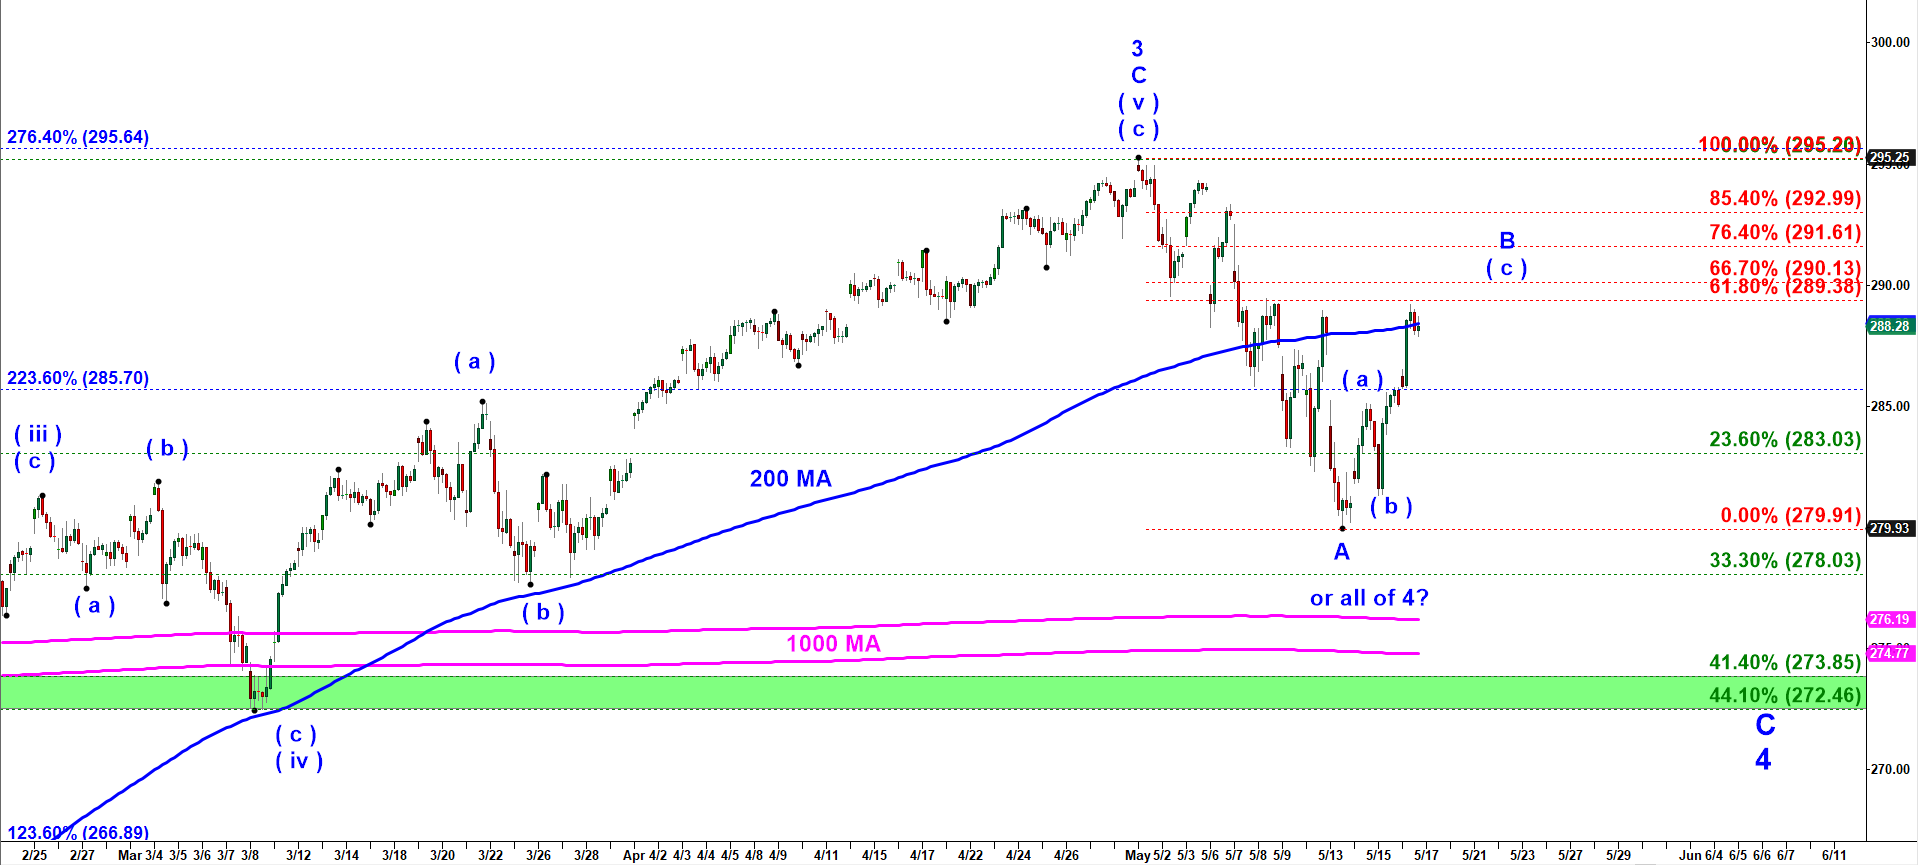
Now we should look for confluence of fibs. Because we expect an (a)-(b)-(c )up structure for that wave ( B ) up, the final segment of that correction in wave c up shall relate to the first segment in wave a up
Now you can see below the very same chart with extension fibs which are potential targets for the wave ( c ) of ( B ) up:
SPY - 90 min chart at 2:50 PM on 5/16/2019
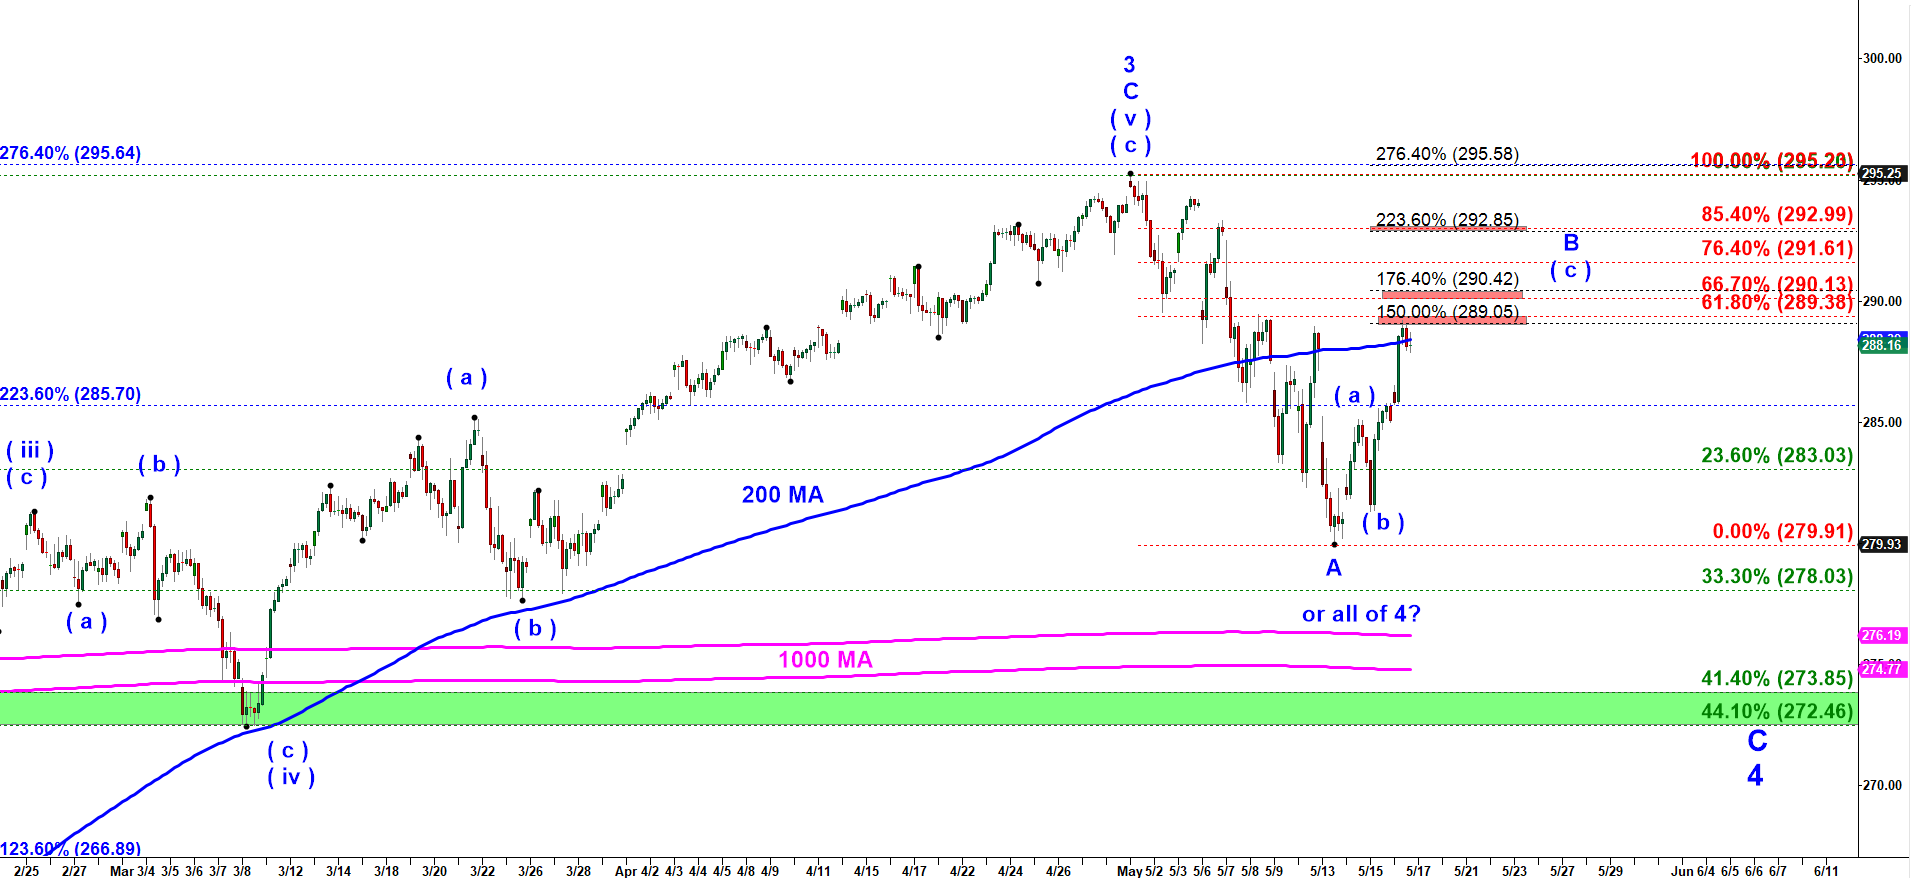
Now you can see three potential zones of reversal. This is where we have a confluence of a retracement fib level with an extension fib level.
Now let me remind you that all of those considerations were based on one important assumptions that we did not see the whole wave 4 down but rather its first leg down.
Conversely, if that was all of wave 4 down (alternative scenario), this move up is the wave A of 5 targeting the top made in early May 2019. Normally, wave A o 5 can not break over the top of wave 3 up.
And once that top is retested we get a pullback in wave B down of 5 up. Again, that is an alternative scenario which does not look very probable at this point.
This is a great example how Elliott Wave theory when properly used makes you think about different scenarios. It makes you look for different paths. Sometimes when two alternative paths point in one direction we get a high probability trading scenario. Sometimes we may have more than three equal probability scenarios. This is when you do not trade. You sit and wait for more clarity carefully collecting evidence to confirm better chances of one of the probable paths
Previous posts:
No posts found.