Skip to content
  • Home
  • US Market Updates
  • Indicators
    • Impulse Master
    • Cycle Trader
    • GANN Levels
    • Subscribe
  • Education
    • Beginners Video Course
    • Intermediate Video Course
      • Syllabus of the Course
    • Trading Like A Pro Video Course
    • Video Lesson of the Week
  • Chat Room
  • Pricing
  • FAQ
  • My Account
  • Login

SPY - has the same bullish look as RTY has

Last night I posted a micro count of RTY and concluded that despite almost unanimous bearish sentiment in the market Russell had been following an impulsive bullish structure off December 2018 lows.

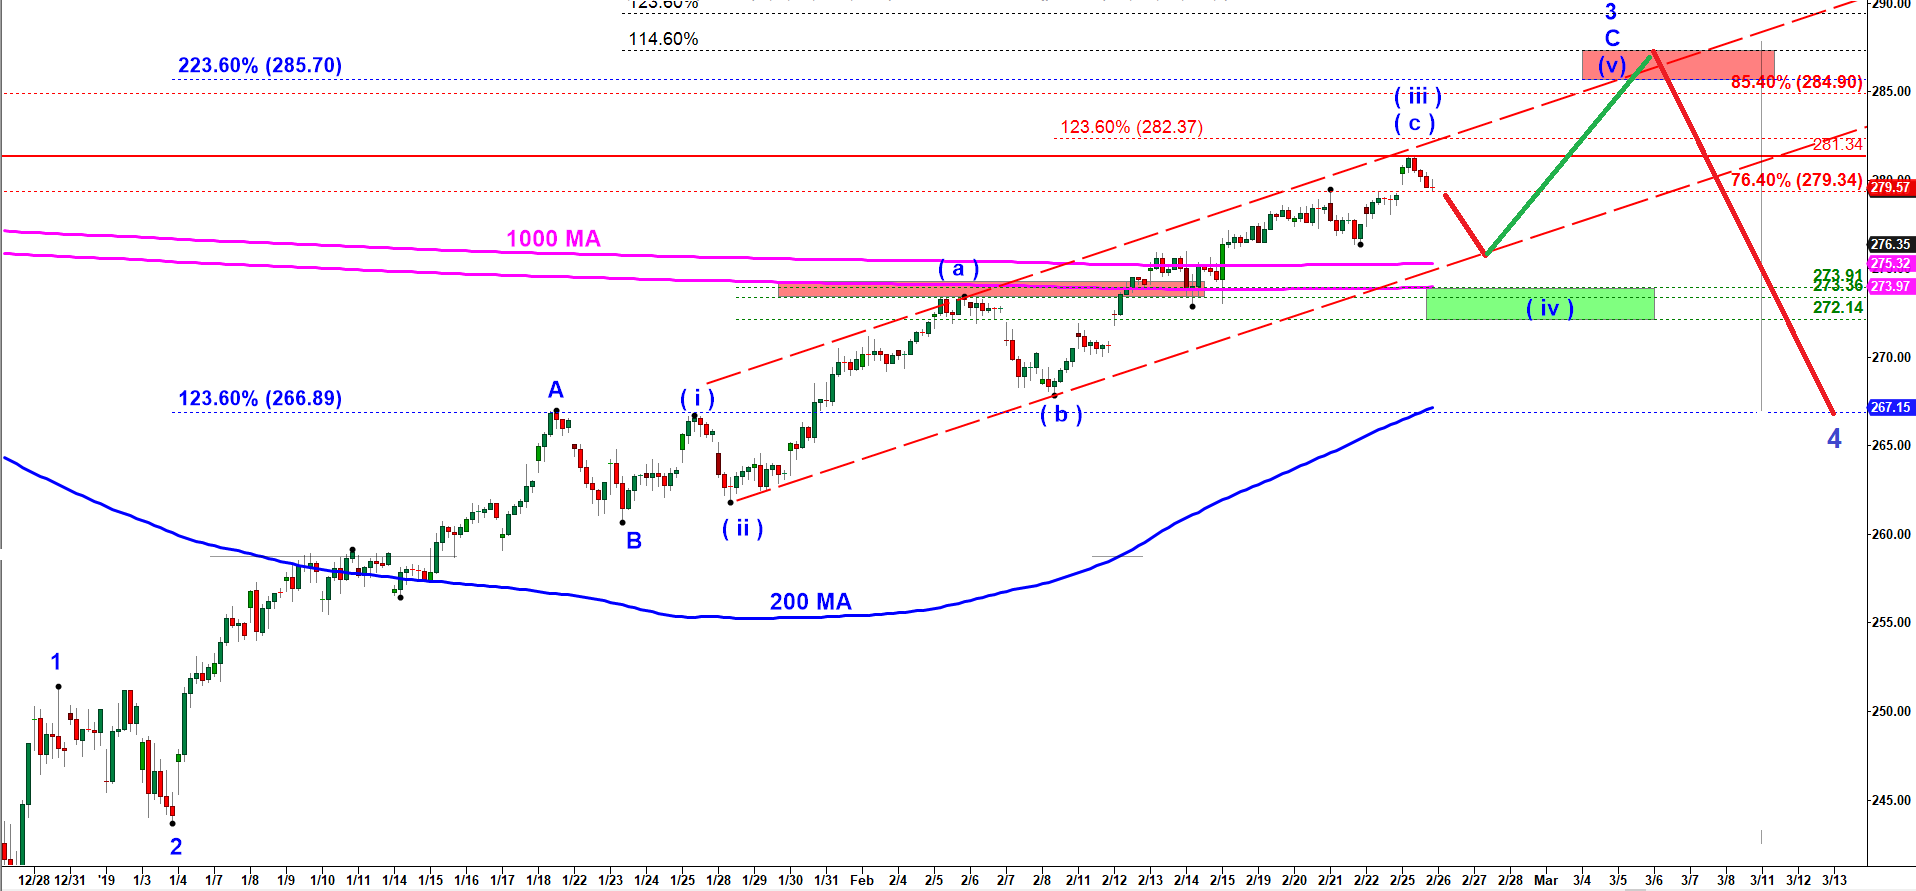
The count of SPY below looks almost identical. The current wave ( iii ) up has either topped or need one more push higher to 282.30. Off the top of that wave ( iii ) up we should get a drop in a corrective wave ( iv ) down. That wave ( iv ) down may target 273.90 – 272.15. Off that green box we should get another rally to 223.6% blue extension at 285.70 or 85.4% red fib at 284.90. That would be the top of a large wave 3 up and this is when we may finally get a meaningful pullback down in wave 4 down targeting 268.30 – 264.70.

SPY- 90 min chart updated on 25 February 2019

Start to learn how to predict the next market move today!
Check out my latest updates

Read my Blog

© 2025 CastAway Trader • Built with GeneratePress