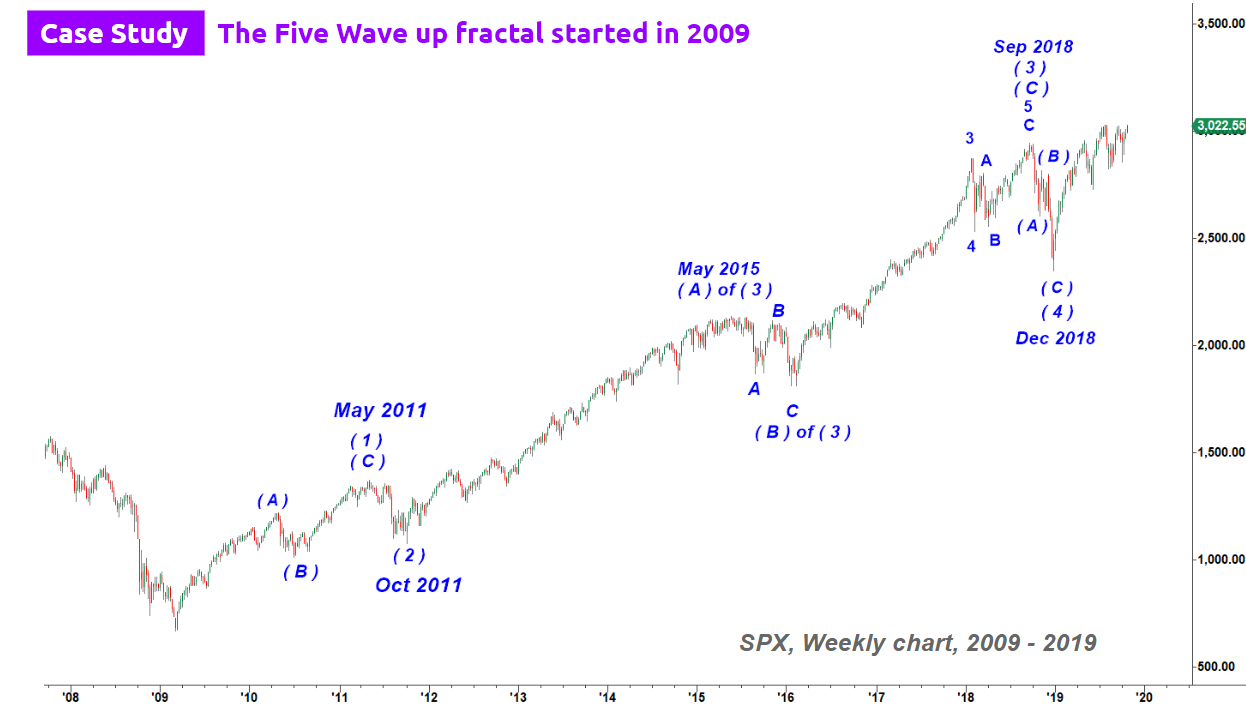
S&P 500 has been nicely following the Five Wave up fractal since 2009.
S&P 500 - Weekly Chart , 2011 - 2019
S&P 500 has been nicely following the Five Wave up fractal since 2009. When you start counting any five waves you should identify a major low and first A-B-C up followed by a corrective A-B-C down making a higher low.
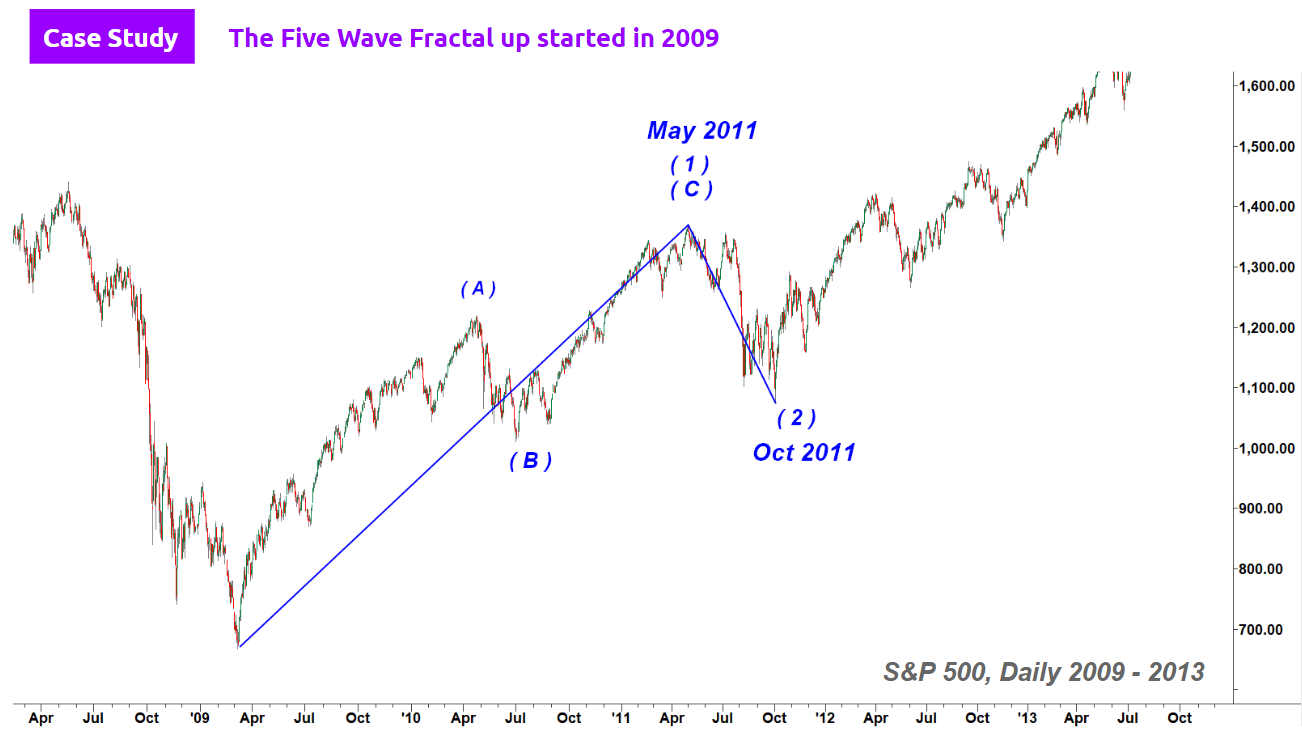
S&P 500 - Daily Chart , 2009 - 2013
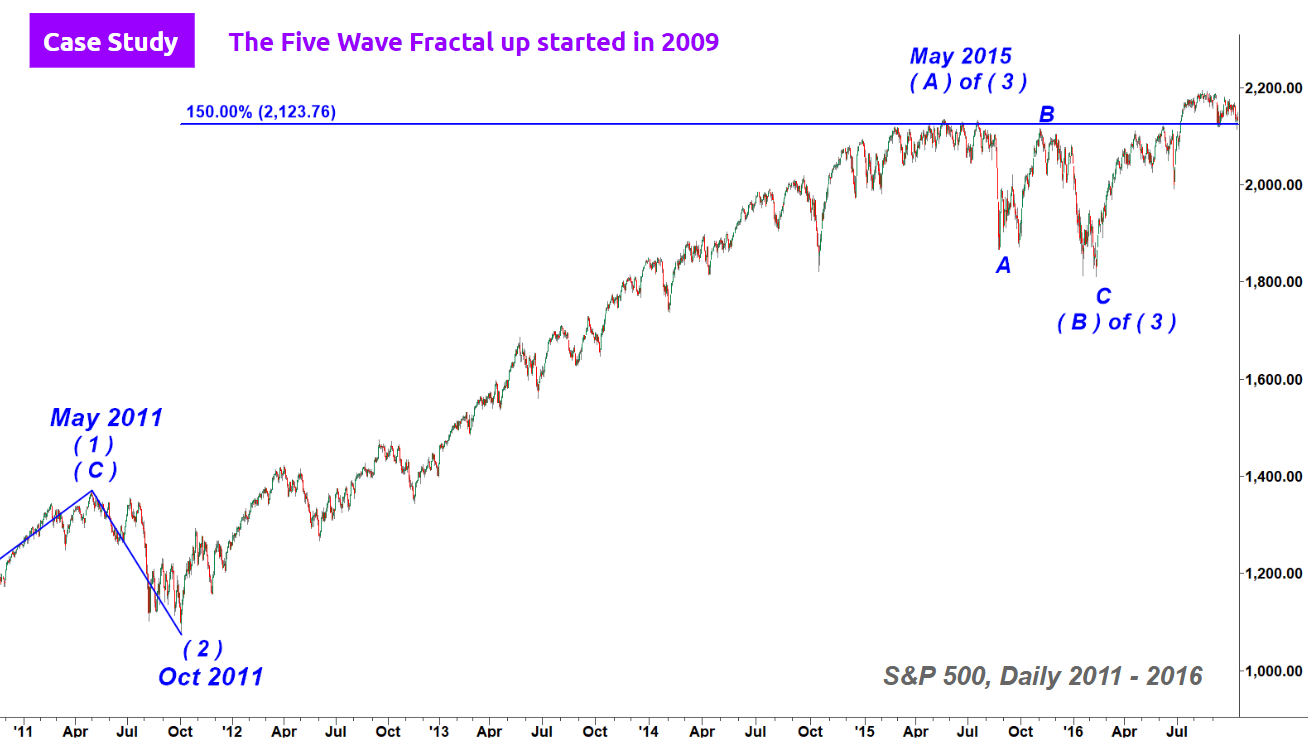
As soon as you get a corrective wave 2 down you may expect the first leg of the strongest wave 3, its subwave A. In this particular case wave ( A ) of ( 3 ) stretched to 150% extension of wave ( 1 ) up projected from the bottom of wave ( 2 ) down. After completion of wave ( A ) of ( 3 ) we should get a corrective pullback in wave ( B ) of ( 3 ) pointing in counter trend direction. As you can see below, we have got a clean corrective A-B-C structure. It is always a bad idea to trade in anticipation of correction in wave B of any degree. As you can see in this case it was very shallow and relatively quick.
S&P 500 - Daily Chart , 2011 - 2016
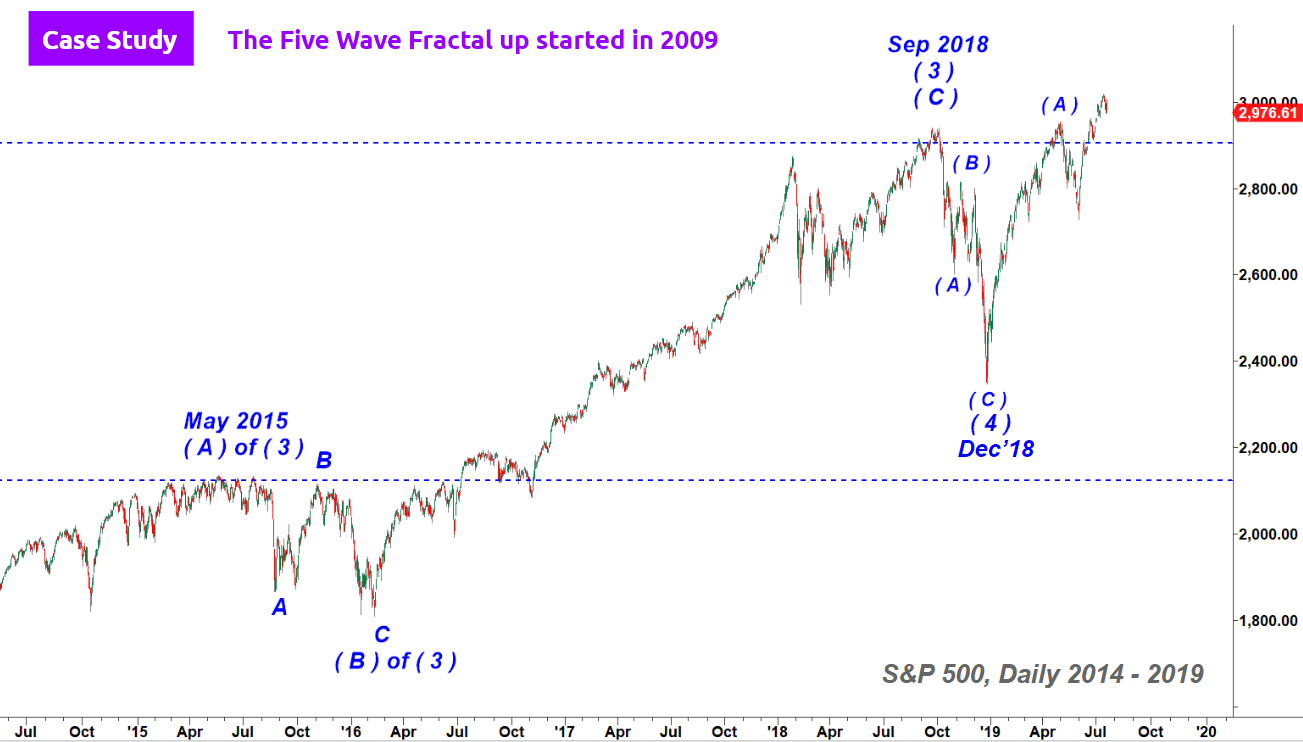
On the chart below you can see the second leg up in wave ( C ) of ( 3 ) that topped in September 2019. Off that top we got a quick and sharp drop in a corrective wave ( 4 ) down. You can clearly see a corrective ( A )-( B )-( C ) structure of that wave ( 4 ) down. When wave ( 4 ) down finds its bottom we get a new rally in wave ( A ) of ( 5 ) up that normally quickly pushes price back up to the previous high made by wave ( C ) of ( 3 ). On the chart below you can see wave ( A ) of ( 5 ) that topped in May 2019.
S&P 500 - Daily Chart , 2014 - 2019
After wave ( A ) of ( 5 ) up tops out we should get a big corrective wave ( B ) down structured as A-B-C. That large corrective wave ( B ) down is only a temporary bearish pullback and is supposed to make only a higher low in comparison to previous low made by wave ( 4 ) in December 2018. In this case wave ( B ) down followed a pretty tricky Running Flat corrective structure. On the chart below you can see that subwave B up topped in July 2019. It managed to make a new higher high over the top of preceding impulsive rally in wave ( A ) up. Moreover, the final subwave C down of wave ( B ) down bottomed over the bottom of the first leg down in subwave A of wave ( B ) down. On the model chart below you can see how the Running Flat structure works. This type of flat corrective structure confirms strength of underlying bullish trend. Even corrective structure manages to make a higher high and higher low.
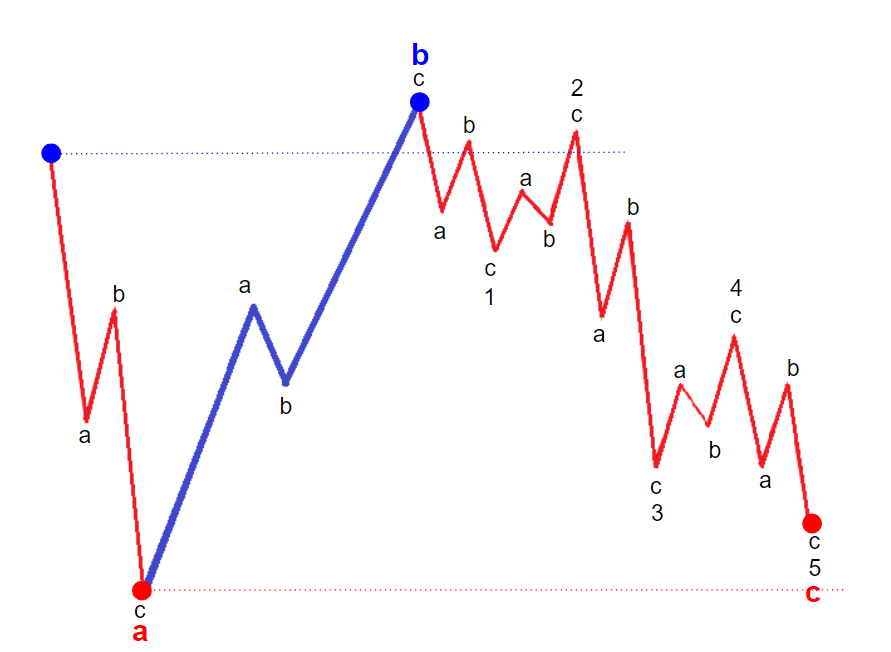
Running Flat corrective structure
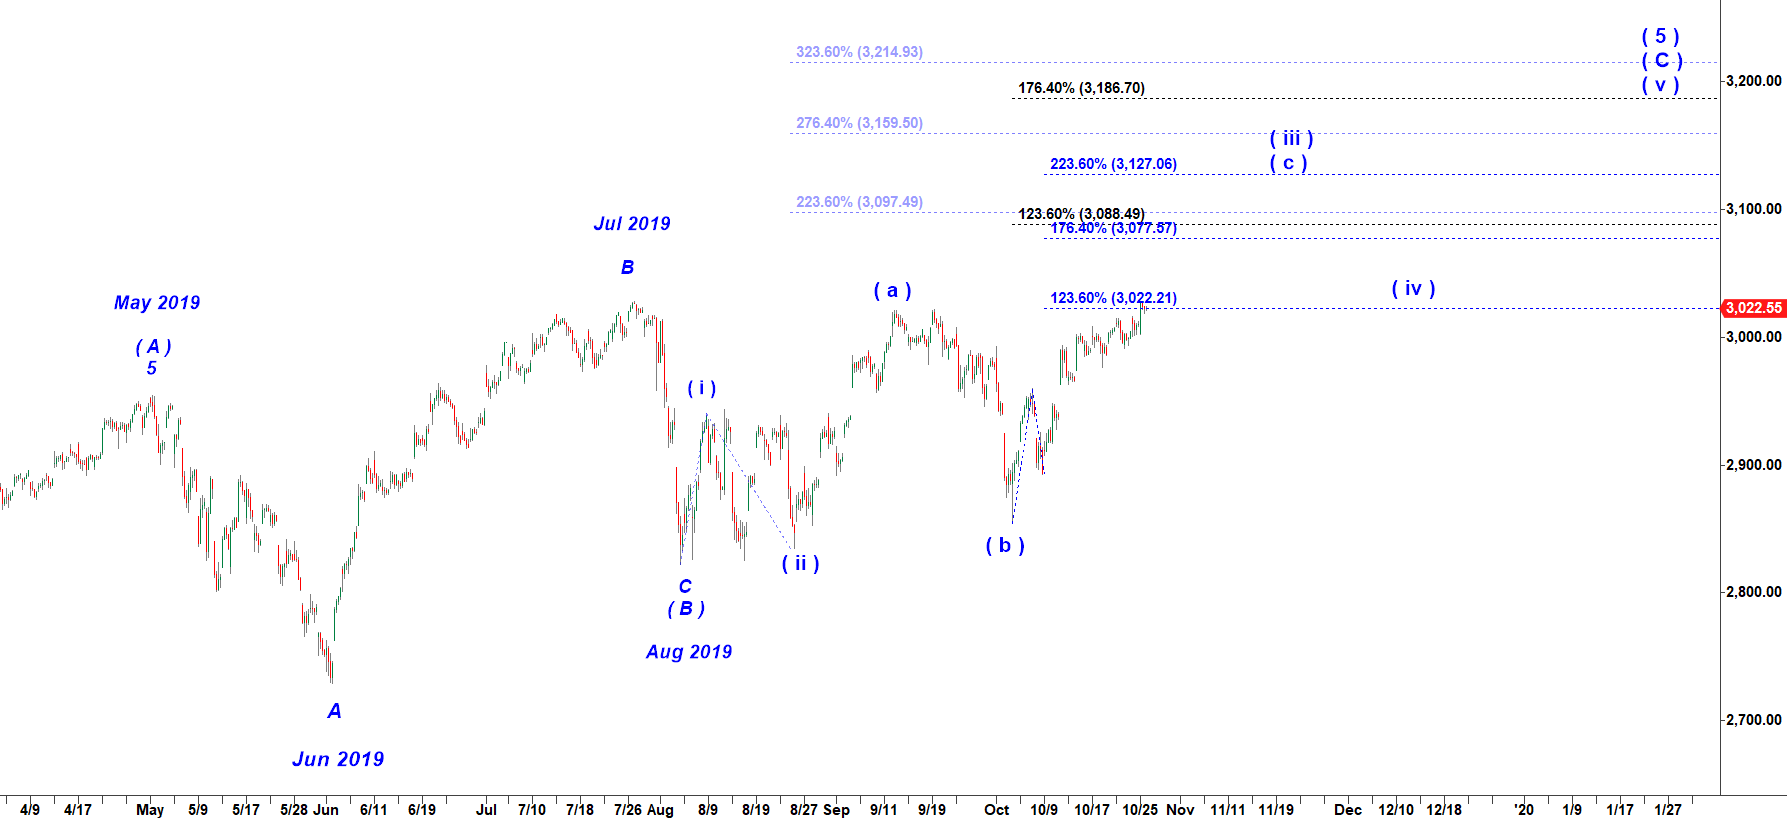
What is important to understand that to complete the whole Macro Five Wave up fractal started in 2009 S&P still needs to get the very final wave ( C ) of ( 5 ) which would make a new all time high and should be at least comparable in size to the rally in wave ( A ) of ( 5 ). That rally in subwave ( C ) of wave ( 5 ) up has to be subdivided into five smaller waves labelled as ( i ), ( ii ), ( iii ), ( iv ) and ( v ). On the 120 min chart below you can see a potential path for this rally. It can easily reach 3,200 but may extend much higher. We will be able to come up with much more accurate prediction and a Red Target Box for this rally after micro waves ( iii ) up and ( iv ) down are completed.