Semiconductors - I did NAIL the top and it has started the big CORRECTION
SMH is a concentrated, predominantly US-based ETF of mega-cap semiconductors companies. It only holds US-listed companies SMH allocates about 1/3 of its portfolio to Intel and Taiwan Semiconductor.
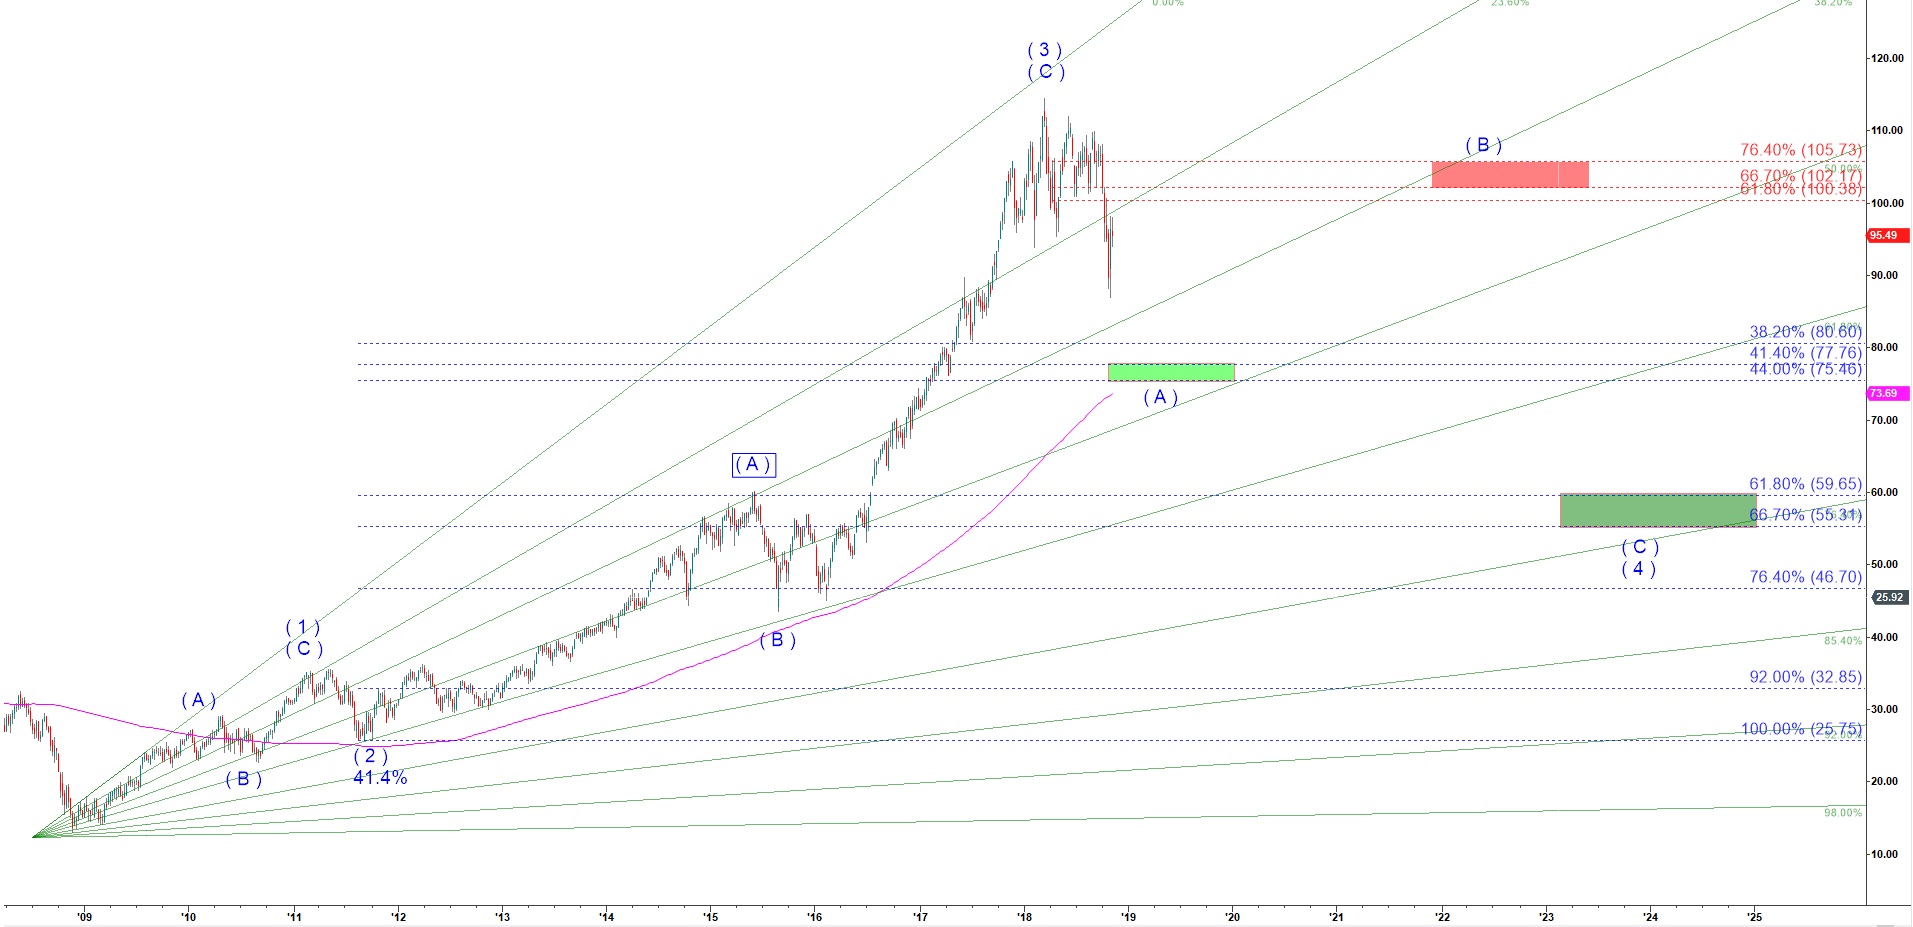
I have been counting a rally off the lows in 2009 as a five wave up fractal. And it is clear that the almost parabolic move up started in August 2015 should be counted as the wave ( C ) of ( 3 ).
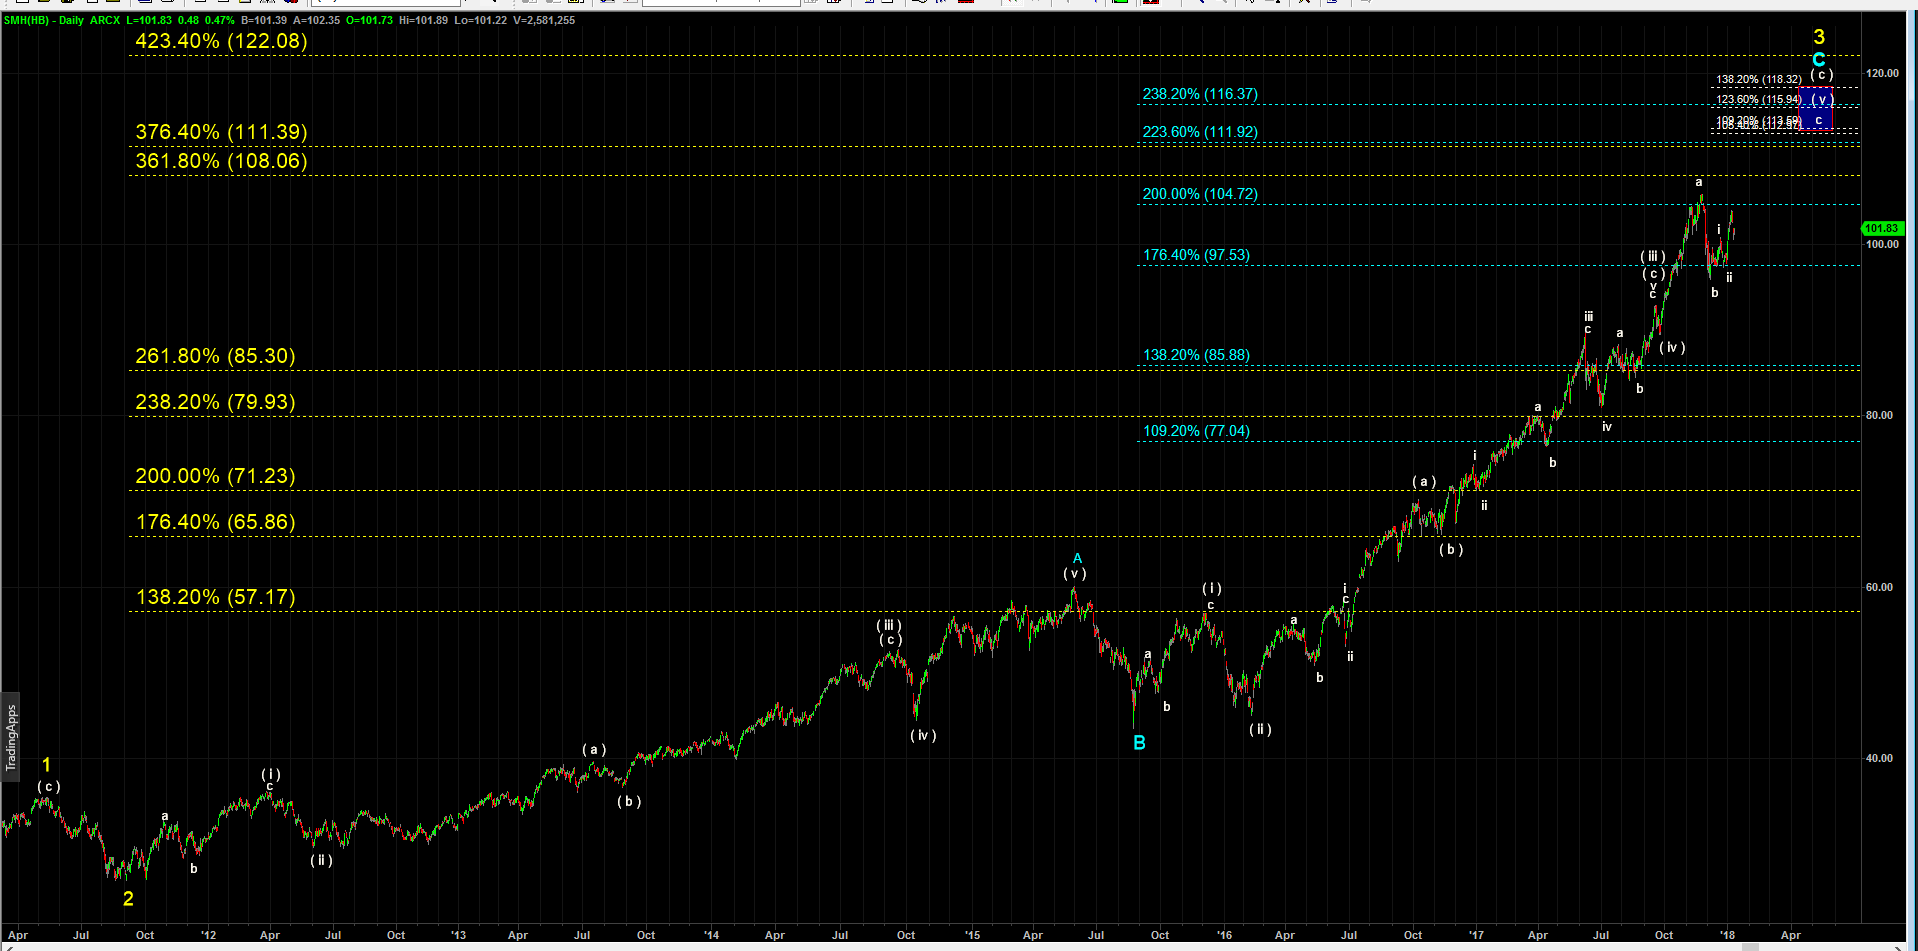
To confirm the top of that accelerated part of the rally in the wave ( 3 ) we should micro count five waves up.
On 11 January 2018 I posted a micro counted chart and predicted that the large wave 3 up will top between 113.6 and 118.3. Two months later SMH topped at 114.55.
SMH - Daily chart updated on 11 January 2018
Below I show you a freshly updated weekly chart of SMH. As you can see wave ( 2 ) was a shallow, quick and simple in structure. Guidance on alternation between corrective waves 2 and 4 suggests that this wave 4 down may get deep, complex and take a long time. At this moment this first drop has not even reached the first most likely target for the wave ( A ) of ( 4 ) down standing at $77.76. Once SMH finds a bottom in wave ( A ) of 4 down we should expect a large bounce up in wave ( B ) of ( 4 ), The final decline in wave ( C ) of ( 4 ) may get as low as 59.65 – 55.31.
That bearish count of the whole sector suggests that you should be very careful with US based semiconductors companies. Because this bearish count for the sector would be a strong head wind to any good setup you may stumble upon in this sector.
SMH - Weekly chart updated on 11 November 2018