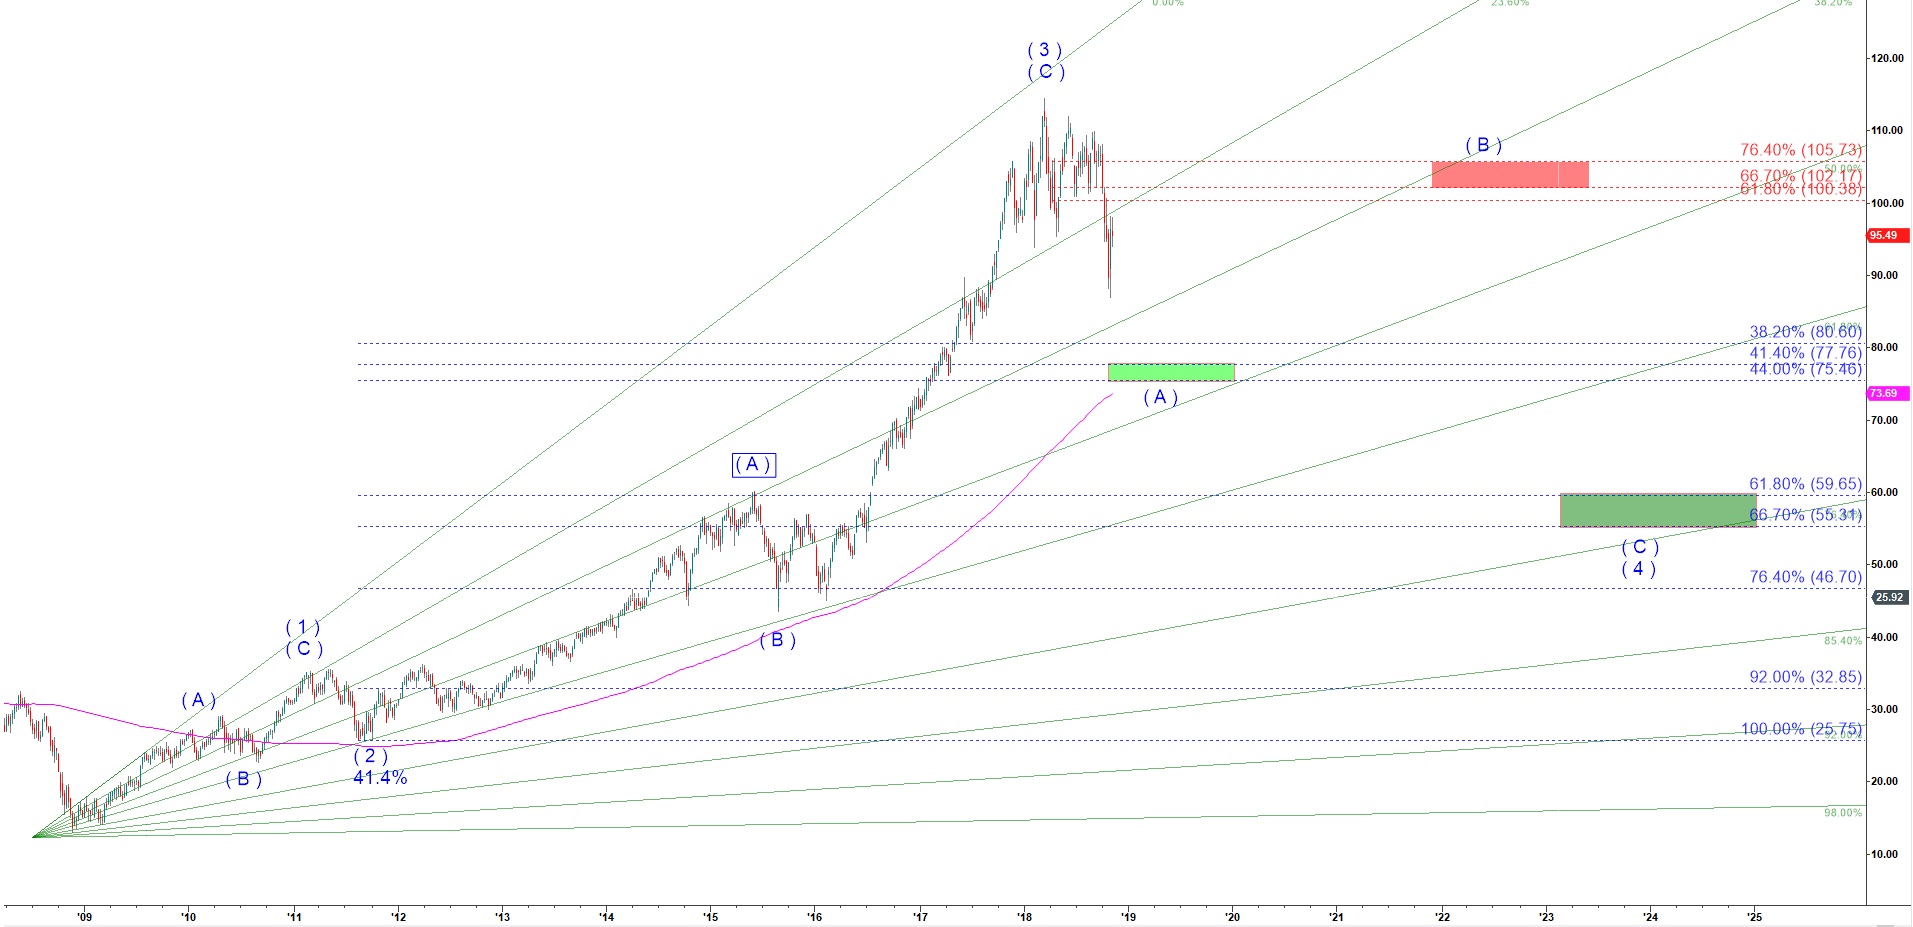
SMH - reached a potential bottom in the target zone
SMH is a concentrated, predominantly US-based ETF of mega-cap semiconductors companies. It only holds US-listed companies SMH allocates about 1/3 of its portfolio to Intel and Taiwan Semiconductor.
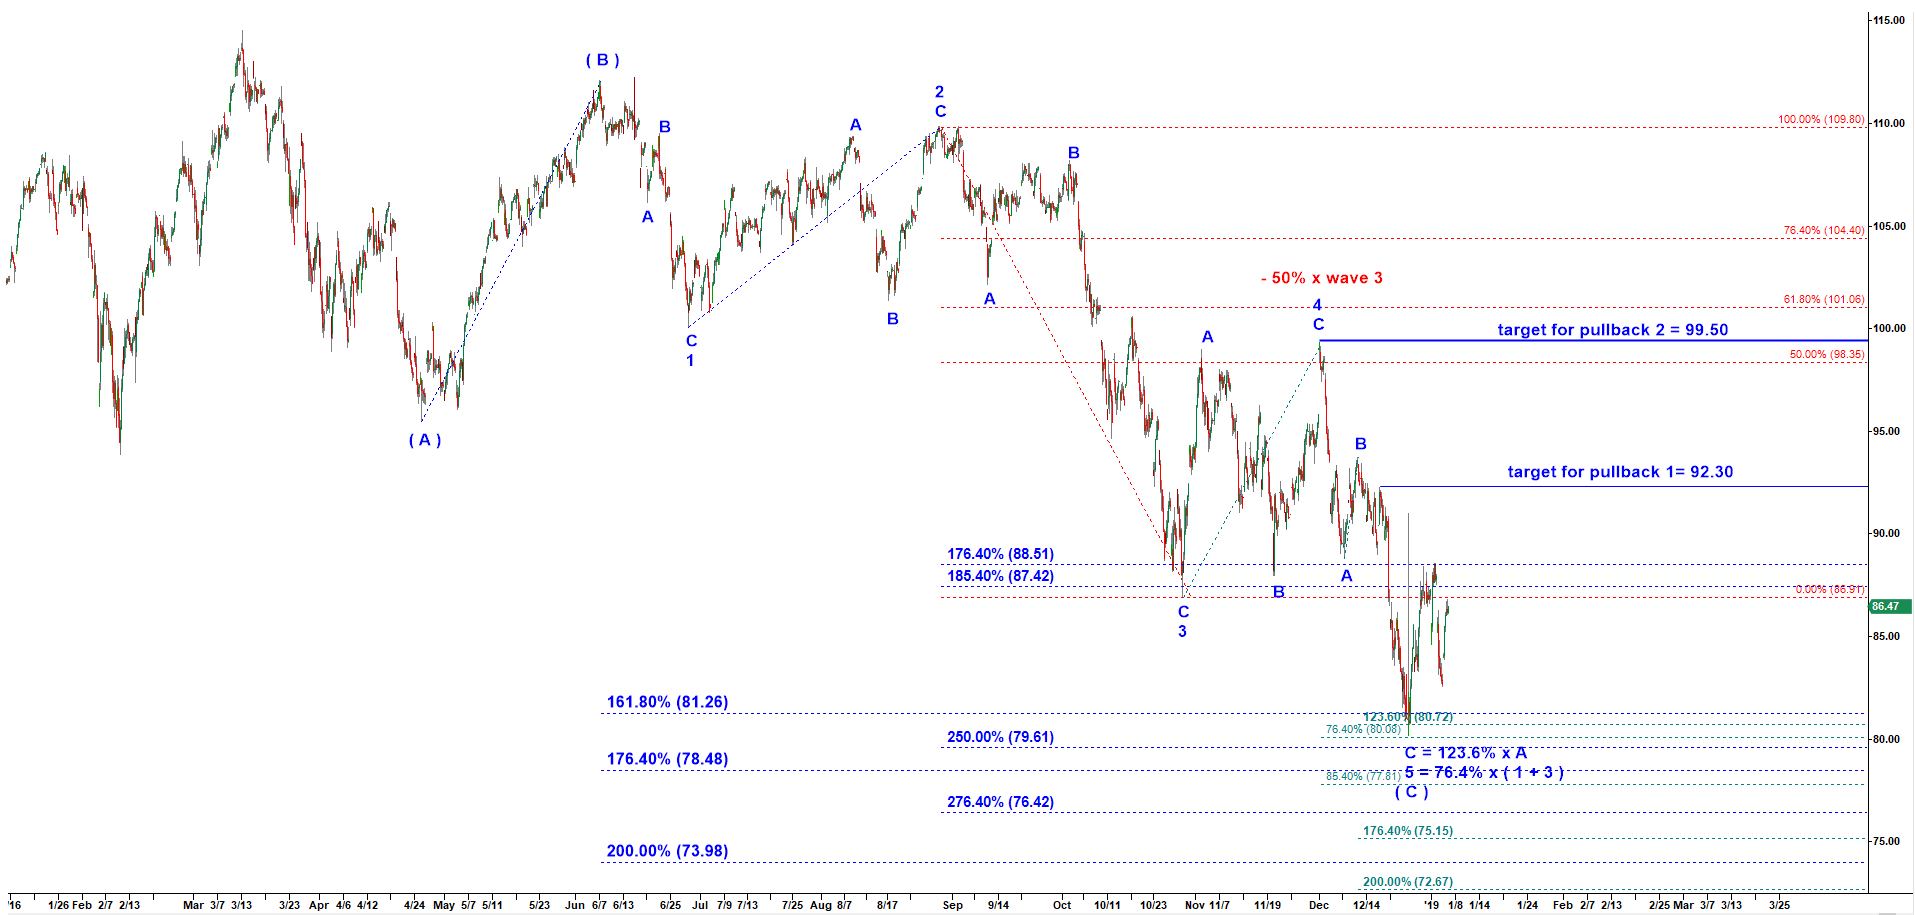
On 26 December 2016, one and a half months later, SMH dropped to 80.71.
It is time to review the structure of that drop to confirm if it looks complete or not. To do that we should zoom-in to the lower time frame of 90 min to be able to make a more precise micro count. As you can see on the chart below, SMH has been working on a large corrective (A)-(B)-(C) down structure. That last wave (C) down should be subdivided into five waves of a smaller degree.
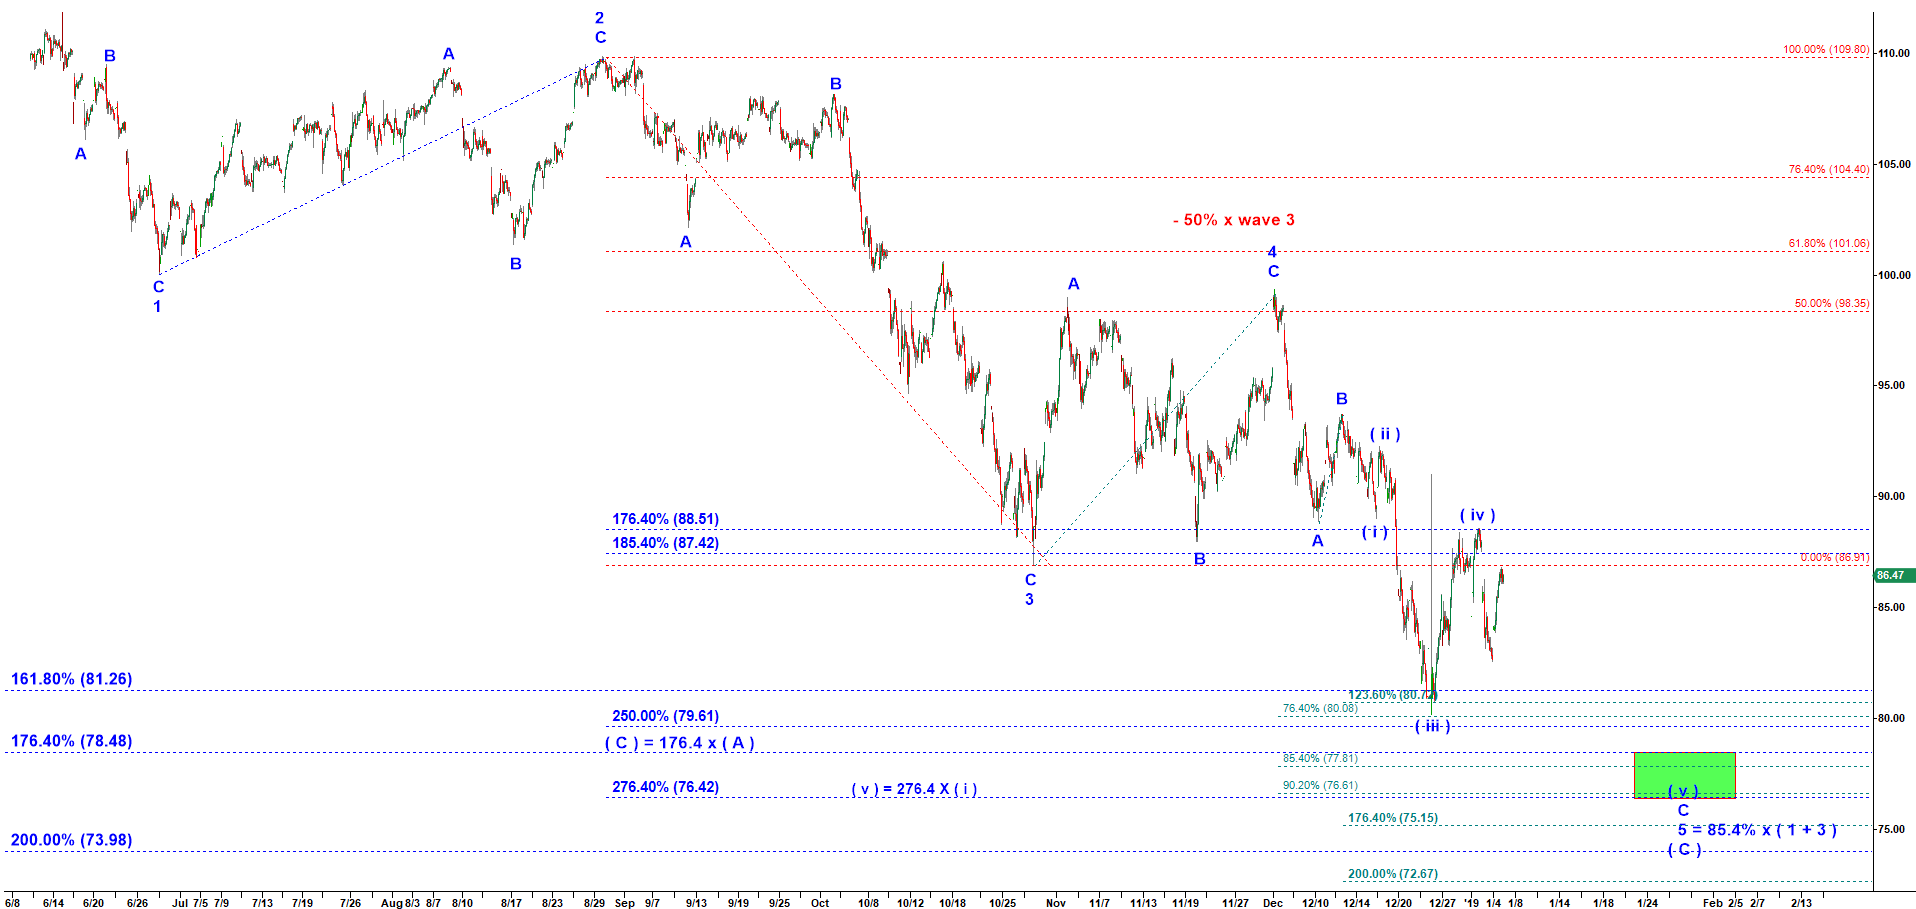
At this point I see two alternatives.
SMH - 90 min chart updated on 5 January 2019
The bullish scenario is that SMH has bottomed in a large wave ( A ) down as was expected in the Daily chart posted on 11 Nov 2018 ( scroll to the first chart on this page ). On the 90 min chart above you can see a completed structure of the five sub waves of the wave ( C ) down.
However, there is a chance that we still may need to make one more low before the large drop in that wave ( A ) down off the March 2018 top. Please see the final chart below. If it makes one more low under the bearish alternative scenario that would be a perfect LONG opportunity. Under both scenarios two high probability targets for a move up are 92.30 and 99.50.