Subscription: Access to Micro Counts of US indices
RTY - it's very difficult to predict where this corrective rally may top
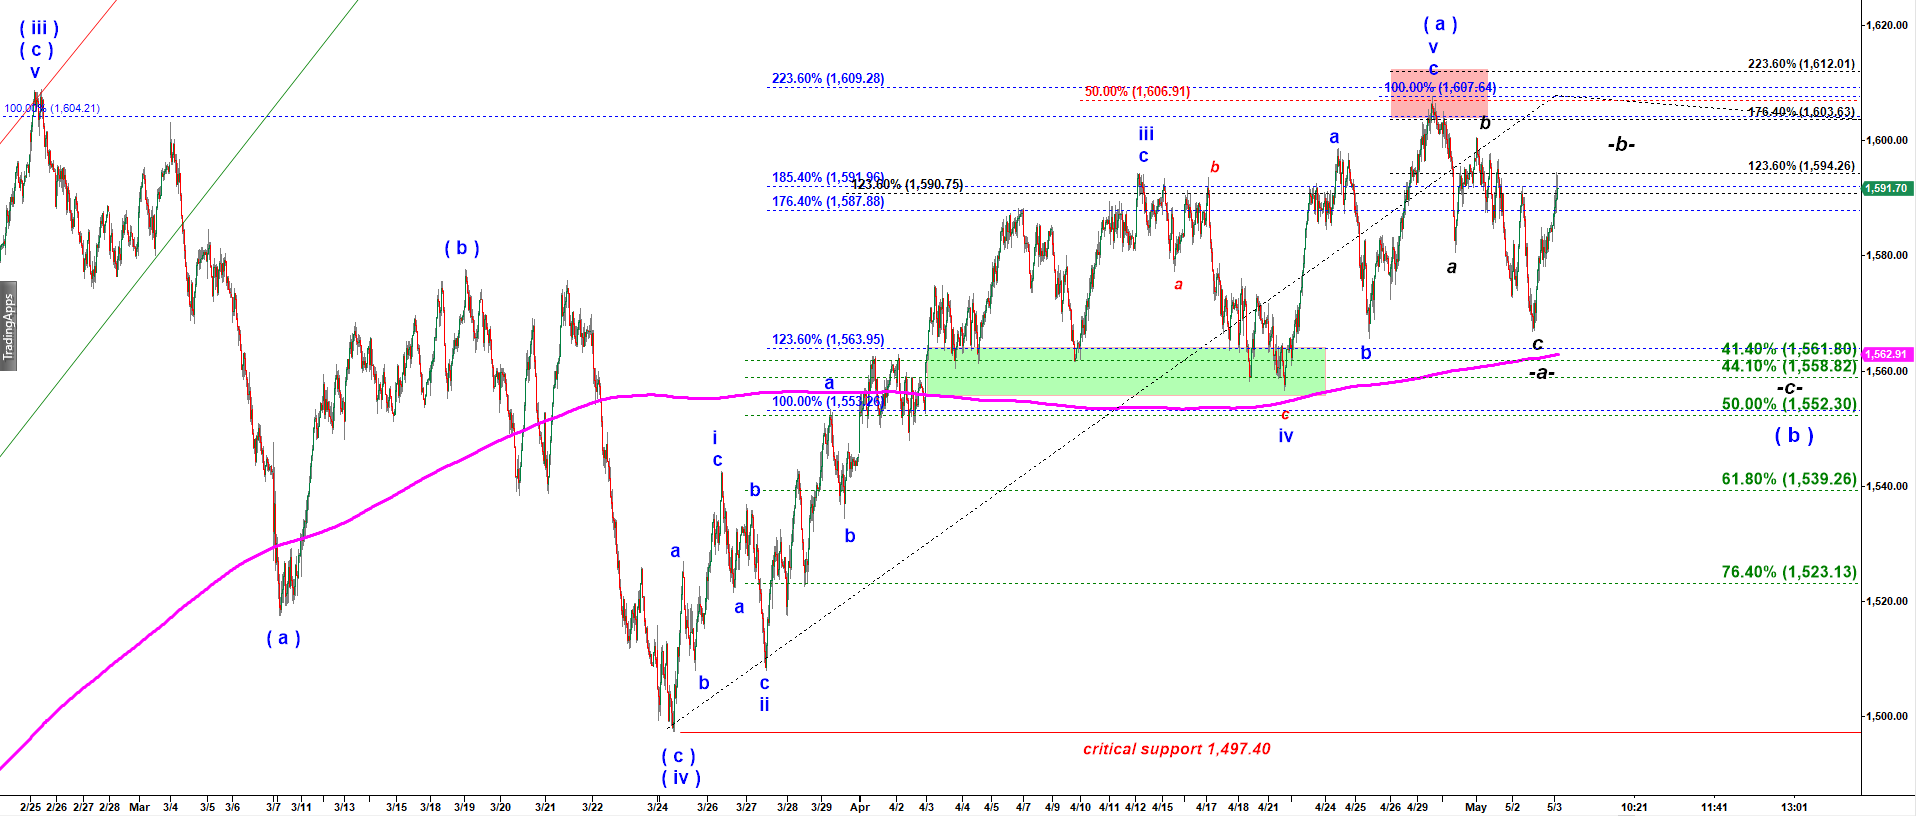
RTY – it’s very difficult to predict where this corrective rally may top
Most likely decline into yesterday’s low was only the first leg of a corrective wave ( b ) down, its subwave -a-.
Then this pullback up is a corrective wave -b- up of ( b ) down.
And we may get another strong drop after that wave -b- up tops out.
The problem from a trading perspective is that wave b in direction of the main trend, which is up, is the least reliable shorting setup.
It can get very strong and can even get over the previous top.
In impulsive waves we can count micro waves to predict where they can top.
in countertrend corrective waves we can look at support levels to predict where they can bottom.
in this case we deal with a corrective wave in direction of the main trend
And we simply do not have any good prediction tool for this case.
RTY - 3,000 tick bar chart updated at 9:20 AM on 5/3/2019
Previous posts:
No posts found.