Subscription: Access to Micro Counts of US indices
RTY - keeps rallying after a completed corrective wave ( b ) down
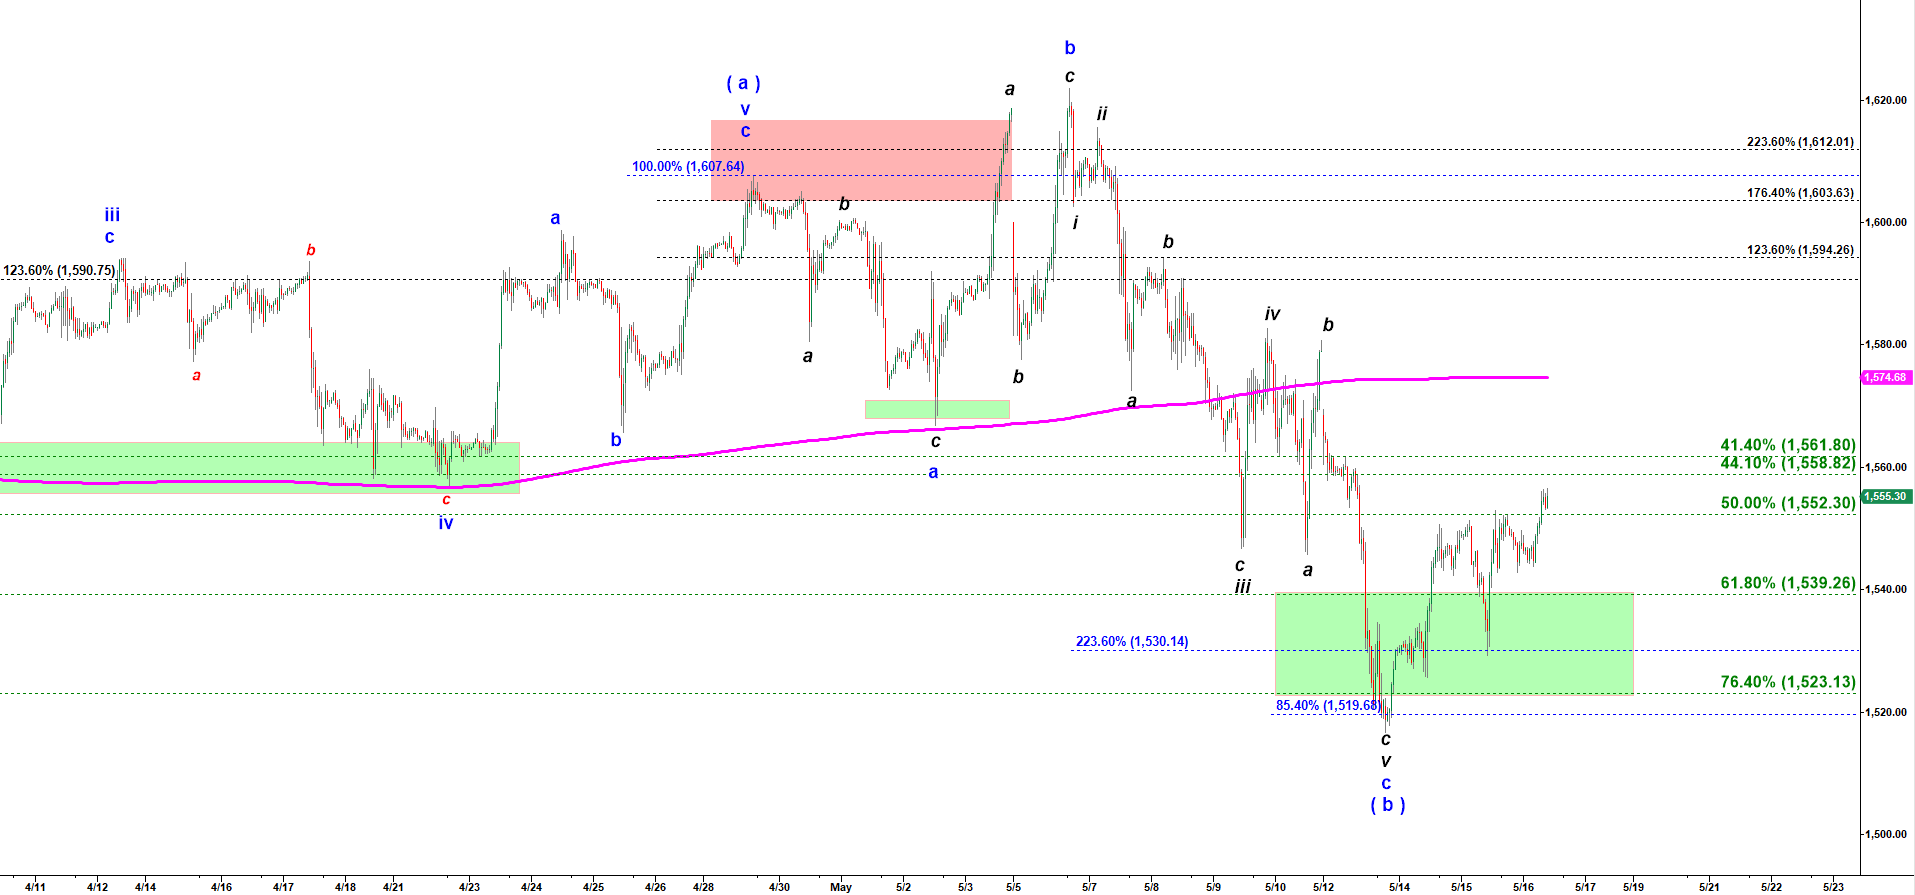
On May 13th I informed you that RTY has “a perfectly completed expanded flat (a)-(b)-(c) structure, where ( b ) made a fake breakout reaching a new higher high over the top made by wave ( a ) up. And the final ( c ) down stretched to a textbook 223.6% extension of wave ( a ) down.”
Since then RTY has been moving higher . This move higher should be counted as ( c ) of ( v ), the final move higher to complete wave ( A ) of ( 5 ), a rally started off Dec 2018 lows. And this wave ( c ) of ( v ) should target new higher high over the top made at 1,621 earlier in May 2019.
At this point it is difficult to identify a micro structure of this rally. I never catch runaway trains. If you miss some setup I do not go crazy and just chill waiting for another good setup. And there will be plenty of them.
RTY - 45 min chart updated at 8:47 AM on 5/16/2019
Previous posts:
No posts found.