Subscription: Access to Micro Counts of US indices
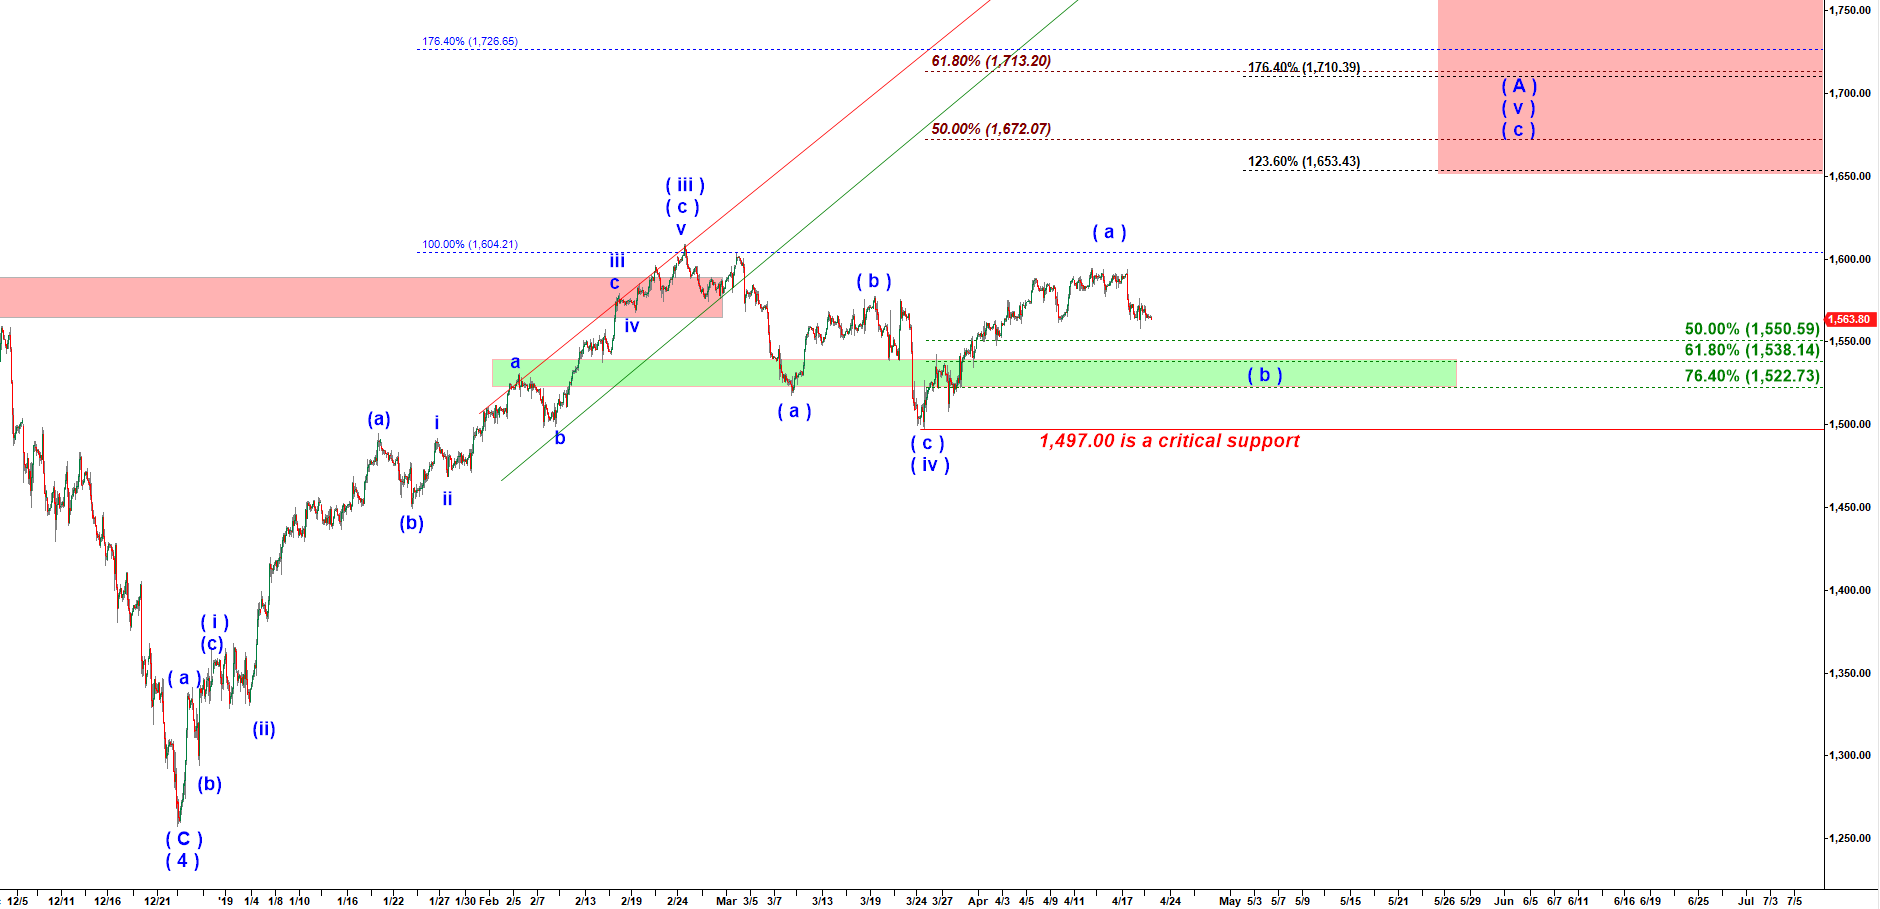
RTY - not clear if wave ( a ) of ( v ) has topped
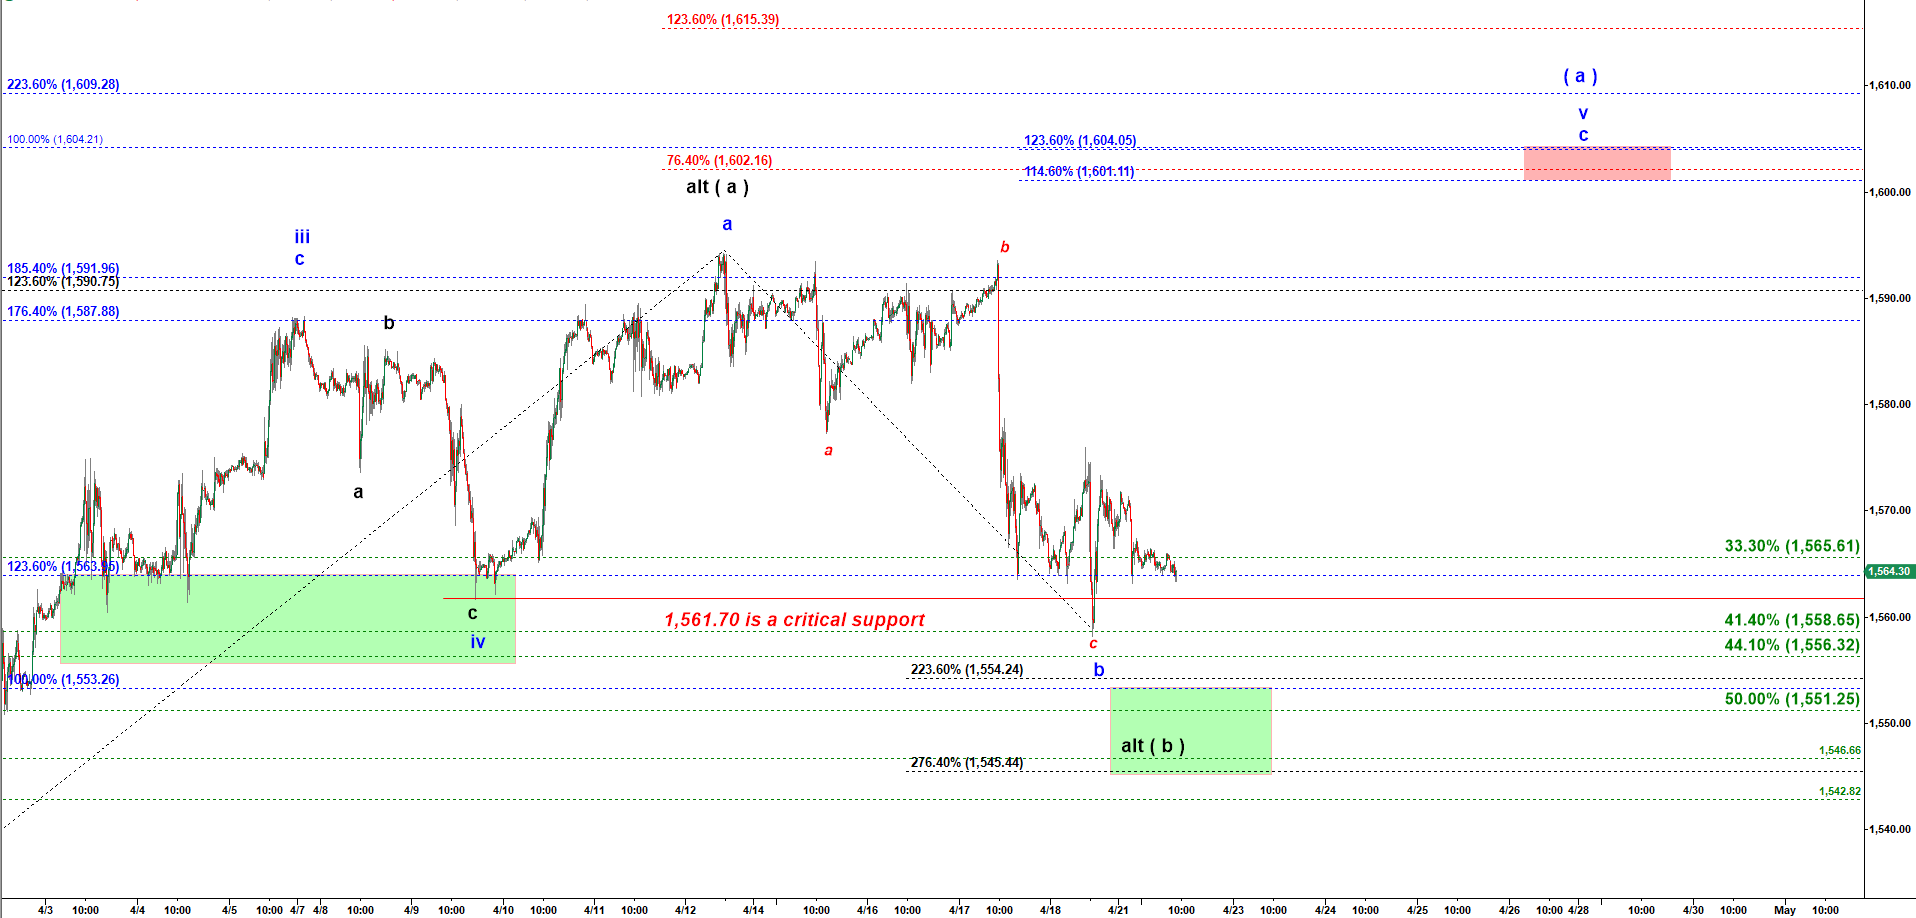
Looking at 120 min chart it is difficult to say whether wave ( a ) of ( v ) has topped. It stretched enough almost tagging the previous top in wave ( iii ) up. Ideally it could make one more high to 1,600 before starting a pullback in wave ( b ) down. Lets scroll down and check its micro structure on the 15 min chart.
RTY - 120 min chart updated at 9:00 AM on 4/22/2019
The fact that the last drop violated the critical support at the low of wave iv down confirms that wave ( a ) up may be completed (black alt count).
Then may get one more low into the green target box that would be either all of wave ( b ) down or just the first leg of ( b ) down. If it is the first leg down then we should get a corrective pullback up that could retest the previous top. In any case my plan is to wait for one more high to short.
RTY - 15 min chart updated at 9:00 AM on 4/22/2019