RTY - has two opposite micro alternatives
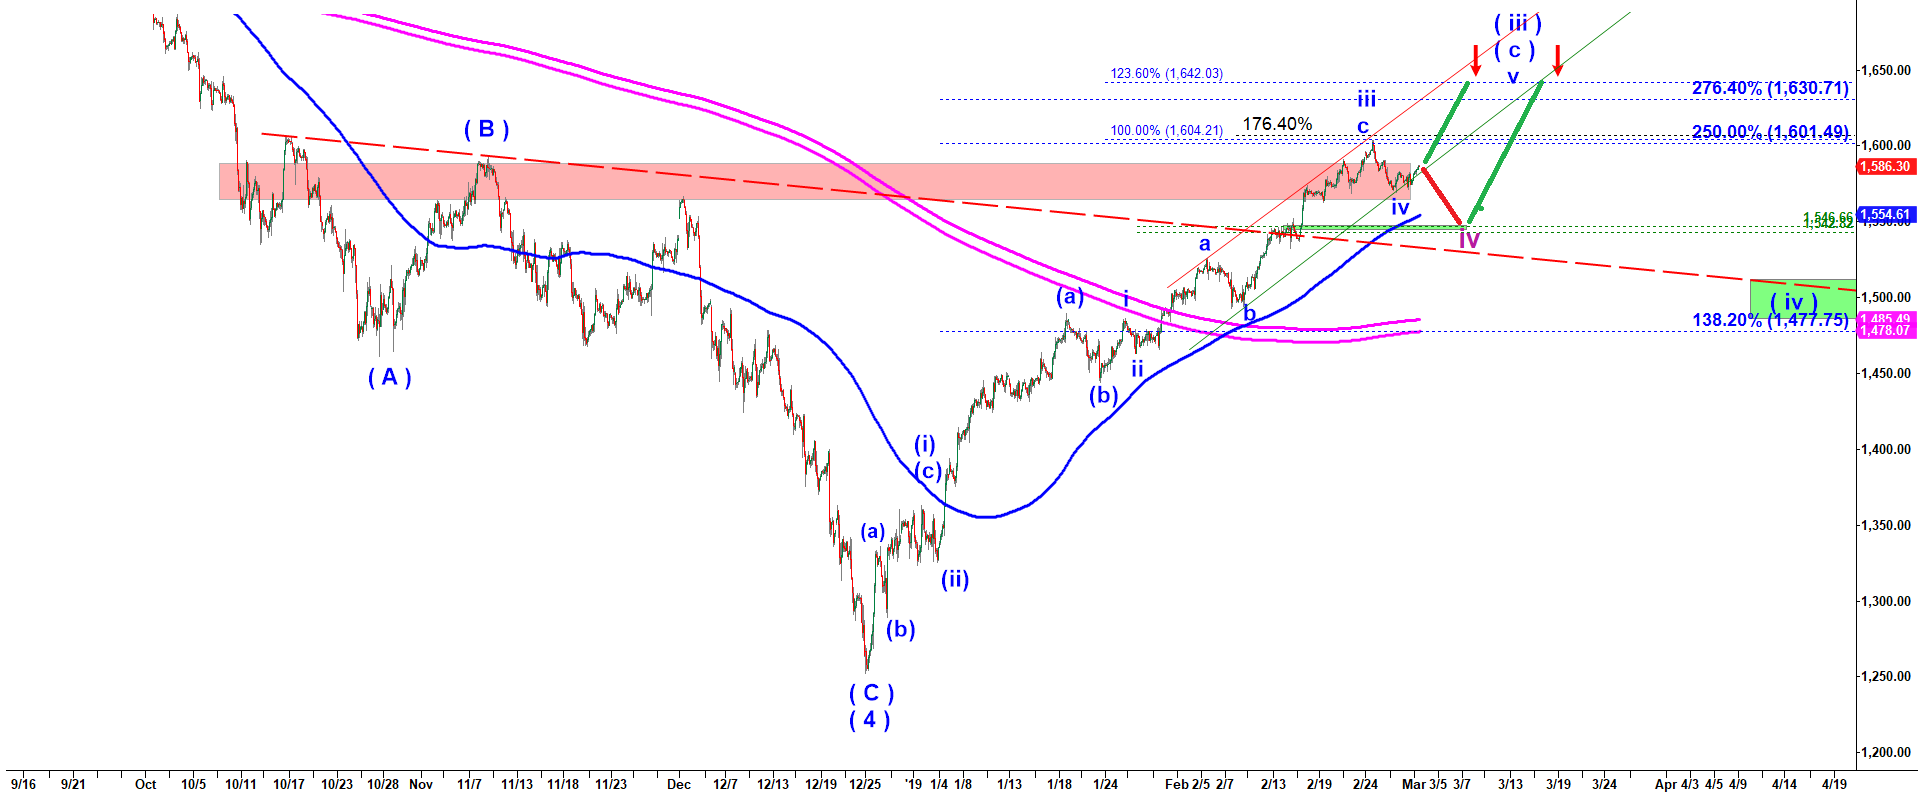
And the question of the day if we have seen a bottom of that wave iv down (in blue ). In favor of the bottom speaks the fact that the decline off the 1,603.60 top looks like a clear corrective a-b-c. In addition, that decline tagged perfectly the down channel. If indeed the iv down was a shallow 23.6% retrace, as I warned you yesterday, then we should see a push to a new higher high in wave v of ( c ) of ( iii ).
However, such you o not see that often such a shallow iv of ( iii ). The very common retracement fib is at least 41.4% of iii. Therefore, I can see that rally as wave b up of iv down with another drop to 1,542. I would say these two scenarios are of equal probability. Not a great trading setup when we do not have preference.
When in doubt we should always check other correlated instruments for hints. I really like how volatility nicely follow wave counts. My micro TVIX count says that they should dump volatility lower before another spike. That currently makes that micro TVIX count a better guide than count of RTY or ES.
RTY - 120 min chart updated on 1 March 2019