NQ-mini - the same bearish count as for ES
Yesterday I posted a bearish count for ES-mini. The structure for NQ looks identical.
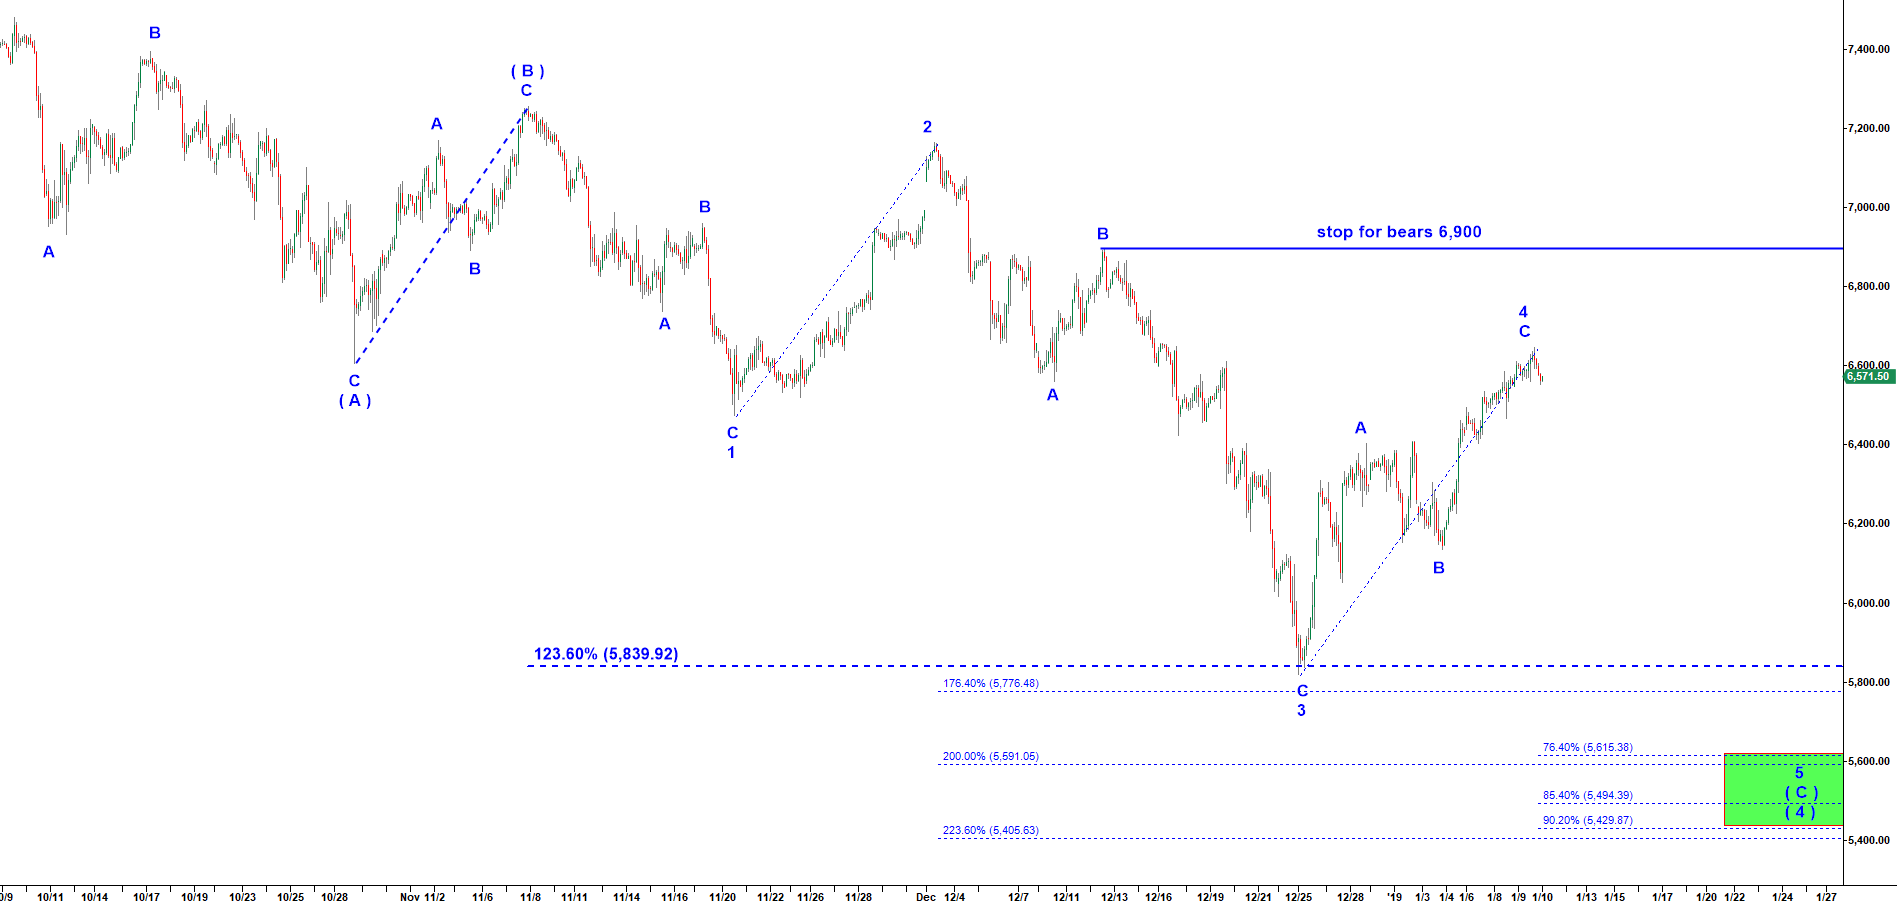
The structure of the decline off the September 2018 top looks like a corrective (A)-(B)-(C) down pattern. The wave (C), the final leg of the correction, shall be subdivided into five subwaves. I count the low made on 25 December 2018 as the bottom of the wave 3 of C. And I count the rally off that low as a corrective A-B-C of wave 4 up. As long as that wave 4 up stays under 6,900 this bearish count is valid.
The ideal target for the final decline in the wave 5 of (C) down is 5,615-5,500.
There is a potential bullish alternative count where we saw wave 5 of (C) bottomed on 25 December 2018. Indeed, on that day NQ hit an important 123.6% extension of the first leg of decline in the wave ( A ) down. But in addition to the right common extension we should look for a completed impulsive pattern of the final leg down in the wave ( C ). And at this moment the low made in December looks better as a bottom of wave 3. And then the following rally structured as A-B-C should counted as wave 4 up. Because of ambiguity I am not going to short this structure. I would rather wait for the market either to invalidate my bearish count or come back down to the green target box where I will be a happy buyer.
NQ -mini - 120 min chart updated on 9 January 2019