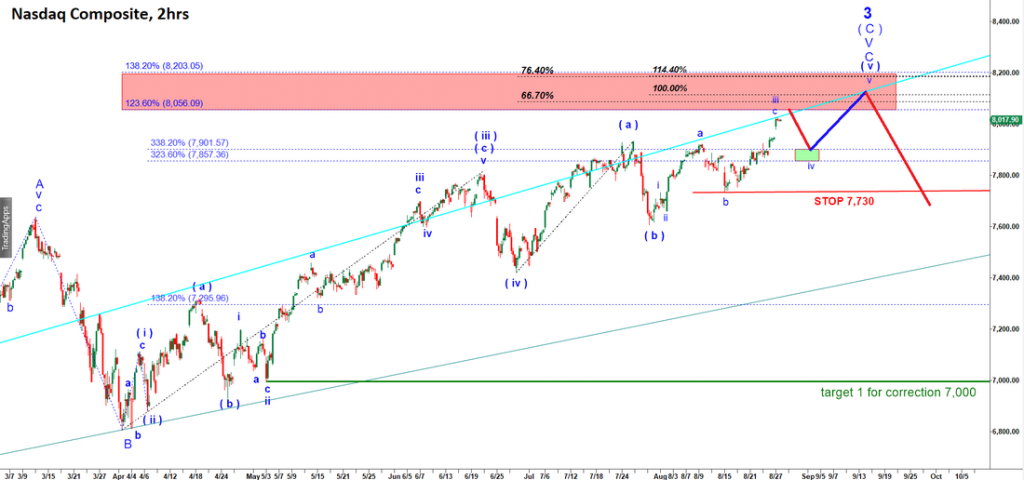
In July and August I posted counts expecting Nasdaq to top in the large wave 3 up. As you can see on the chart posted on August 28th, I expected the Composite index to top in the area between 8,056 and 8,203. It has topped at 8,133.
Off the top of that large wave 3 up we are supposed to get a corrective wave 4 that should be structured as large wave A – B – C move down.
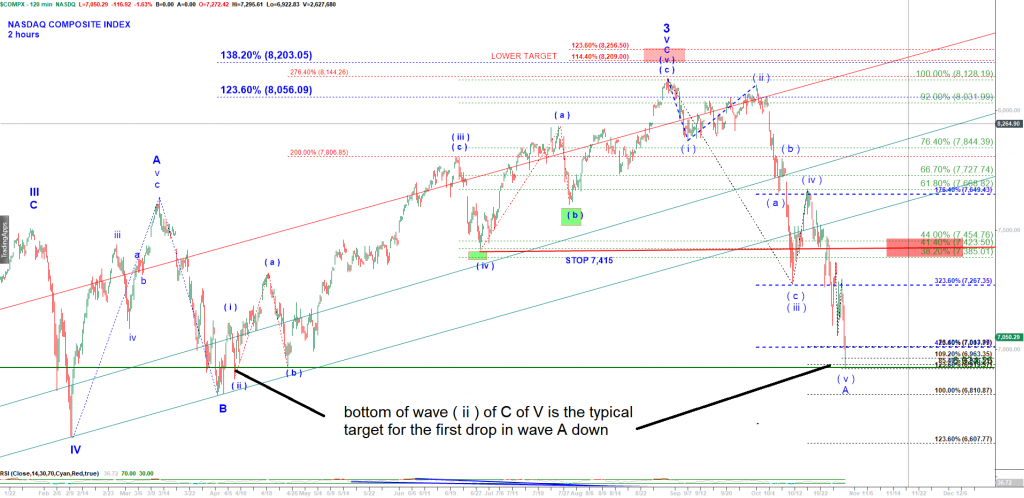
My micro count shows a fully completed impulsive looking move down. That move down is either all of wave A down (the primary scenario ) or the first leg subwave a of A down (less likely ). In ether case, Nasdaq has hit a very strong support today and now we can expect a corrective looking a-b-c move up. The first target in a of B will be the area of 7,385 – 7,454 (corresponding to 38.2% – 41.4% retracement of the whole decline ). Once the first move up gets completed, we will see a drop in wave b of B which depth is impossible to predict at this point. We can retest the lows made by wave A down but does not have to go that deep. And then finally we should get an impulsive looking wave c up that may target 7,668 (61.8% retracement and retesting the broken up channel from below ).