• Home
  • US Market Updates
  • Education
    • Beginners Video Course
    • Intermediate Video Course
      • Syllabus of the Course
    • Trading Like A Pro Video Course
    • Video Lesson of the Week
  • Blog
  • Chat Room
  • Pricing
  • FAQ
Menu
  • Home
  • US Market Updates
  • Education
    • Beginners Video Course
    • Intermediate Video Course
      • Syllabus of the Course
    • Trading Like A Pro Video Course
    • Video Lesson of the Week
  • Blog
  • Chat Room
  • Pricing
  • FAQ
CastAway Trader - Premium Trading Chat Room
CastAway Trader Predict the Next Market Move

A week ago I nailed the very bottom of a corrective wave ( iv ) down in gold miners for subscribers of my Private Chat. Here you can read how that pullback was first predicted and then followed the path I predicted and arrived into the Green Target box. Since then gold and miners showed impressive strength and have made new higher highs. They keep following my count and are about to hit important resistance zone in a structure that looks 95% completed. GDX is about to complete wave 3 up and start a corrective wave 4 down.

Subscription: Premium Chat & Full Access to All the Charts

posted at 9-35 AM on August 1, 2019:

GDX has opened with a drop into the Demand Zone.

GDX 15 min chart updated at 9.35 AM on 8-1-2019

Subscription: Premium Chat & Full Access to All the Charts

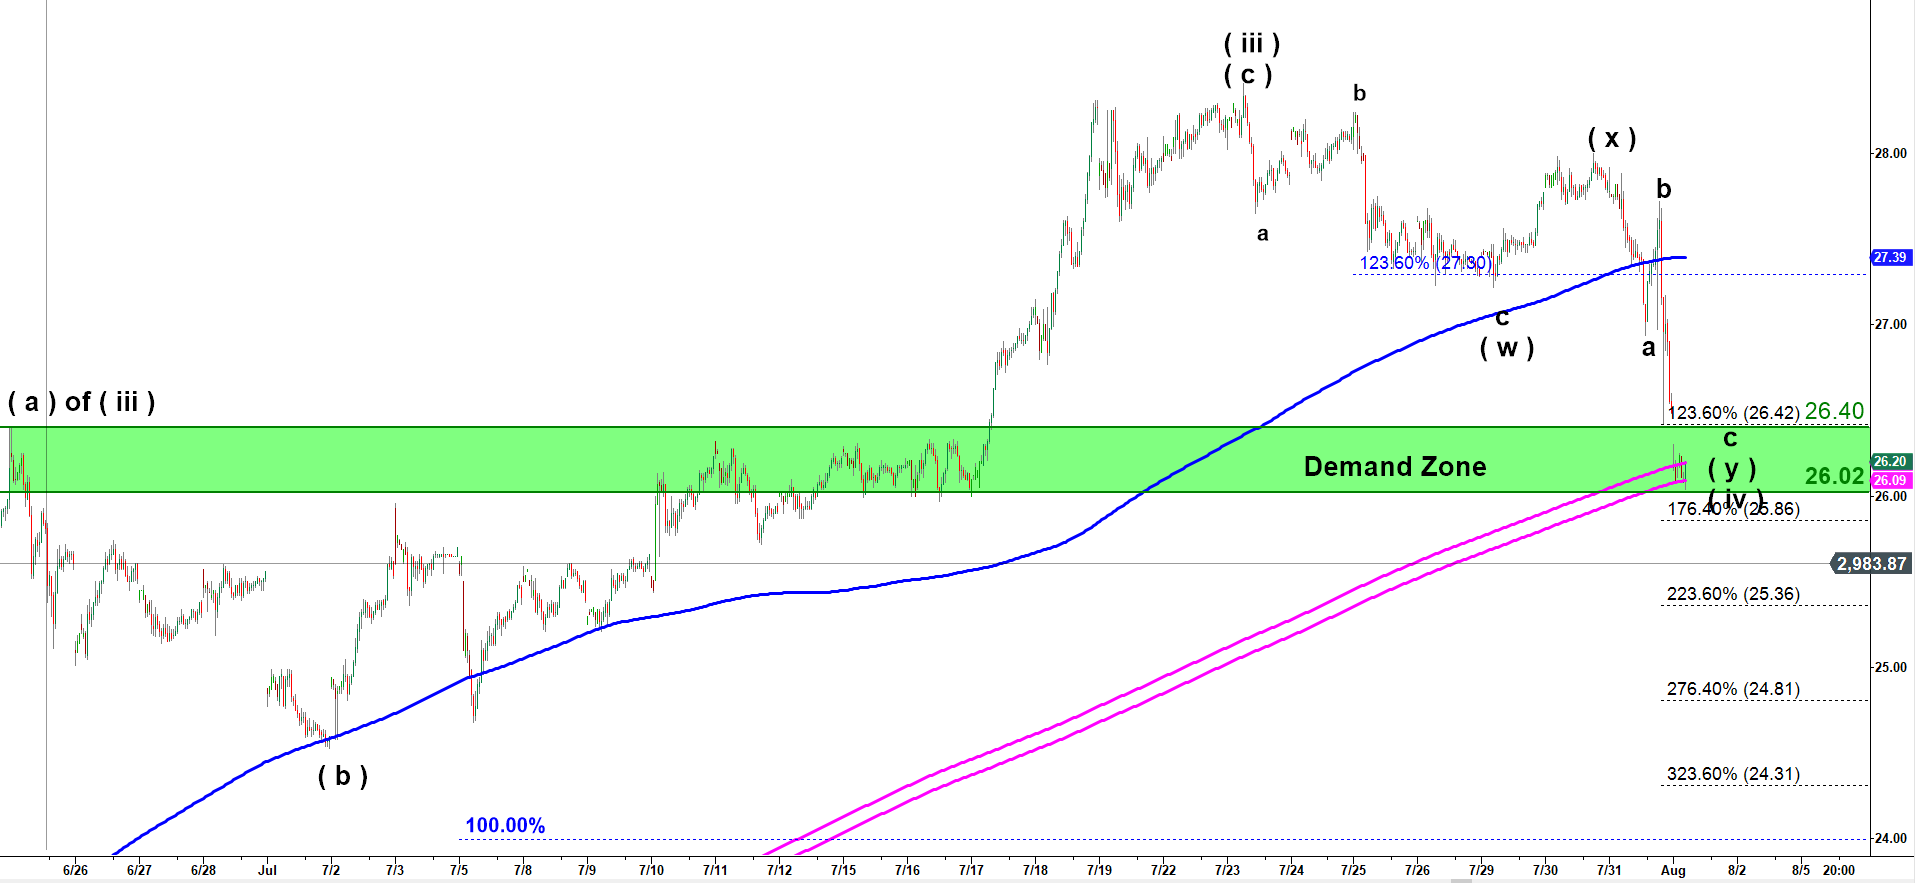
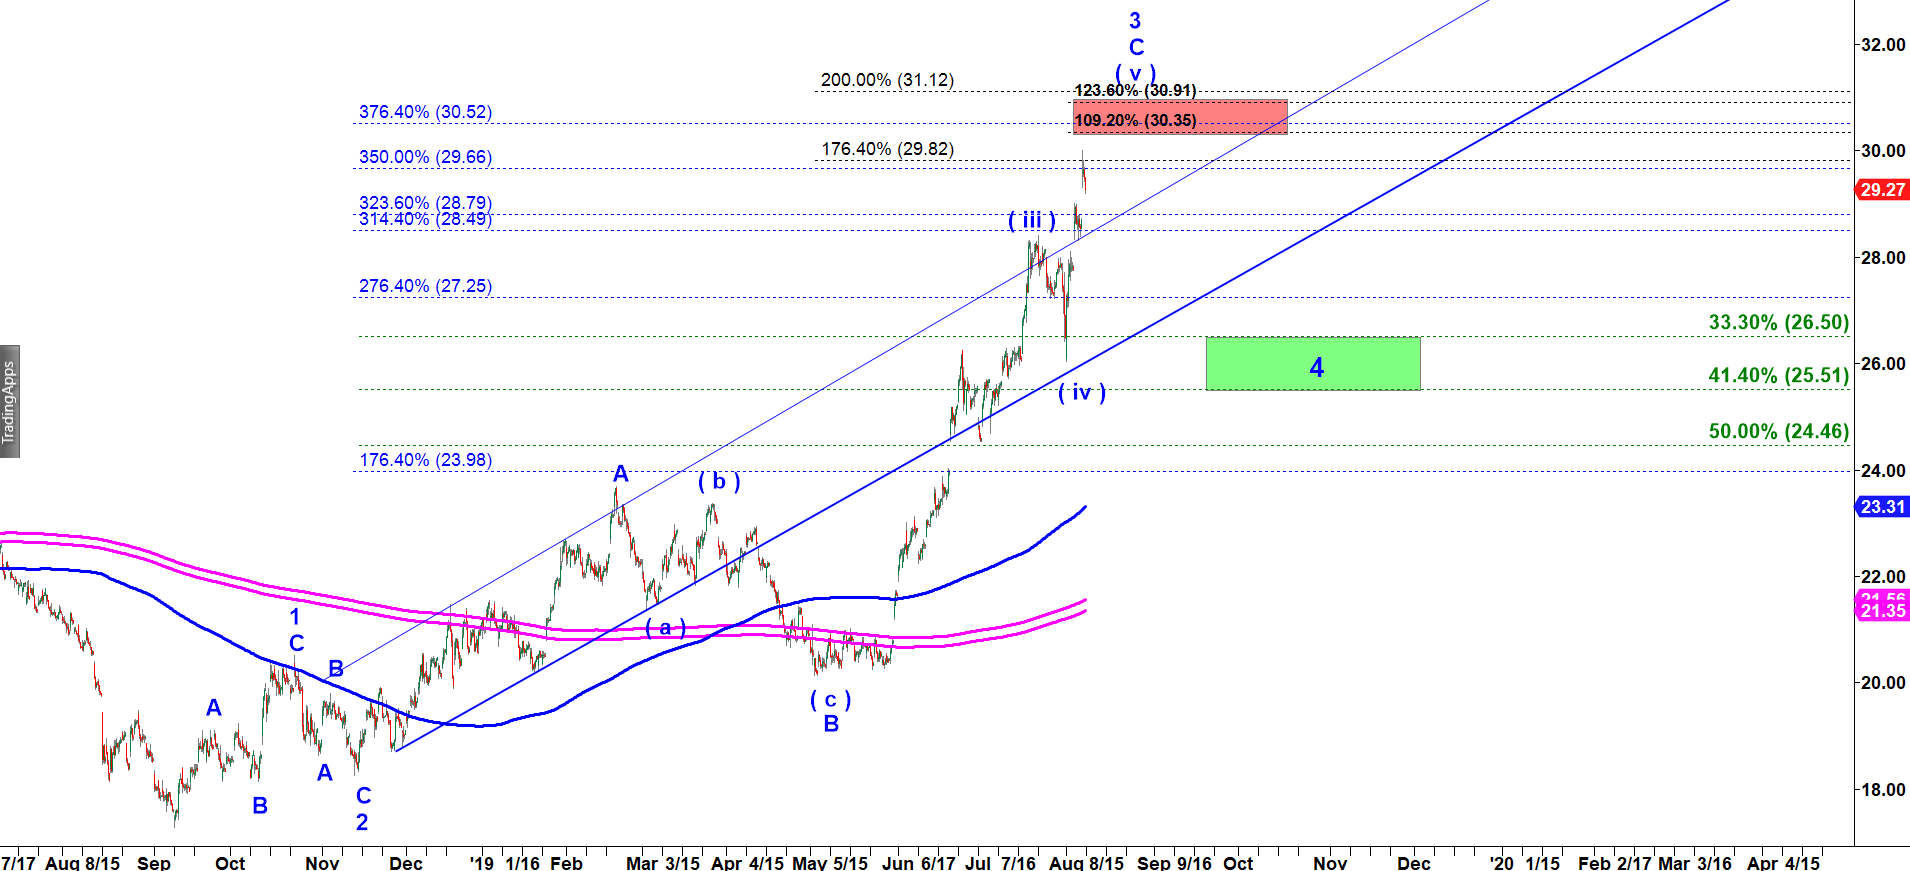
As you can see on the chart below, the drop that bottomed on August 1, 2019 was only a minor wave ( iv ) down. Off that low we got another rally to new higher highs in wave ( v ). That is the final wave that concludes the strongest part of the rally in wave C of 3 up. As soon as it tops out we should get a correction of bigger size in wave 4 down. That correction will drive prices back down at least to the lows made on August 1. Yesterday I sold significant part of my long term core portfolio of gold miners. I will be closely monitoring development of that topping setup on a micro scale for subscribers of my Premium Chat.

GDX daily chart updated on 8-8-2019

Tags
$ES $SPX a-b-c- up pullback a-b-c up Bearish reversal Bear Market Rally Bitcoin Bottoming Breakdown breakout Bullish Wedge corrective pullback Crude Oil Daily Double Three DXY ES Expanded Flat Expanding Triangle failed breakdown failed breakout Green Box Head and Shoulders i down - ii up setup Inverse Head and Shoulders i up - ii down setup Macro micro Month Opening Range NQ one more higher high Red Box RTY Running Flat S&P short setup SPX topping toppying trading setup triangle Triple Three weekend Weekly YM
Read my Blog

  • My Account
  • Login
Hestia | Developed by ThemeIsle