Skip to content
  • Home
  • US Market Updates
  • Indicators
    • Impulse Master
    • Cycle Trader
    • GANN Levels
    • Subscribe
  • Education
    • Beginners Video Course
    • Intermediate Video Course
      • Syllabus of the Course
    • Trading Like A Pro Video Course
    • Video Lesson of the Week
  • Chat Room
  • Pricing
  • FAQ
  • My Account
  • Login

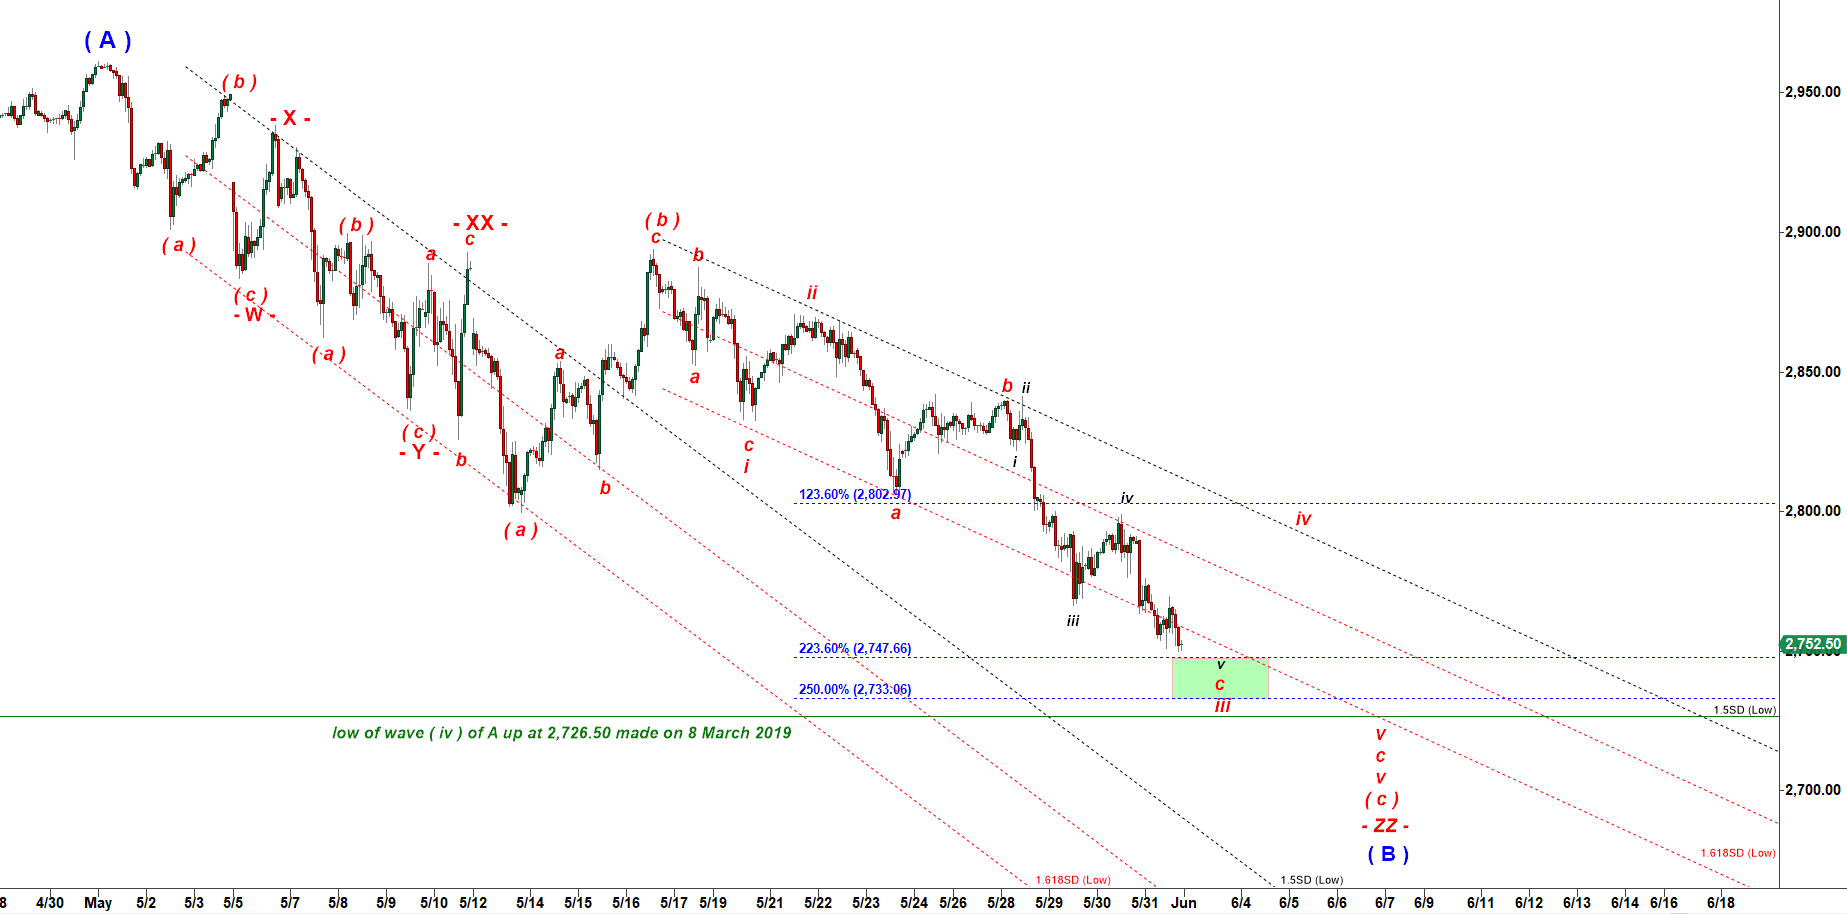
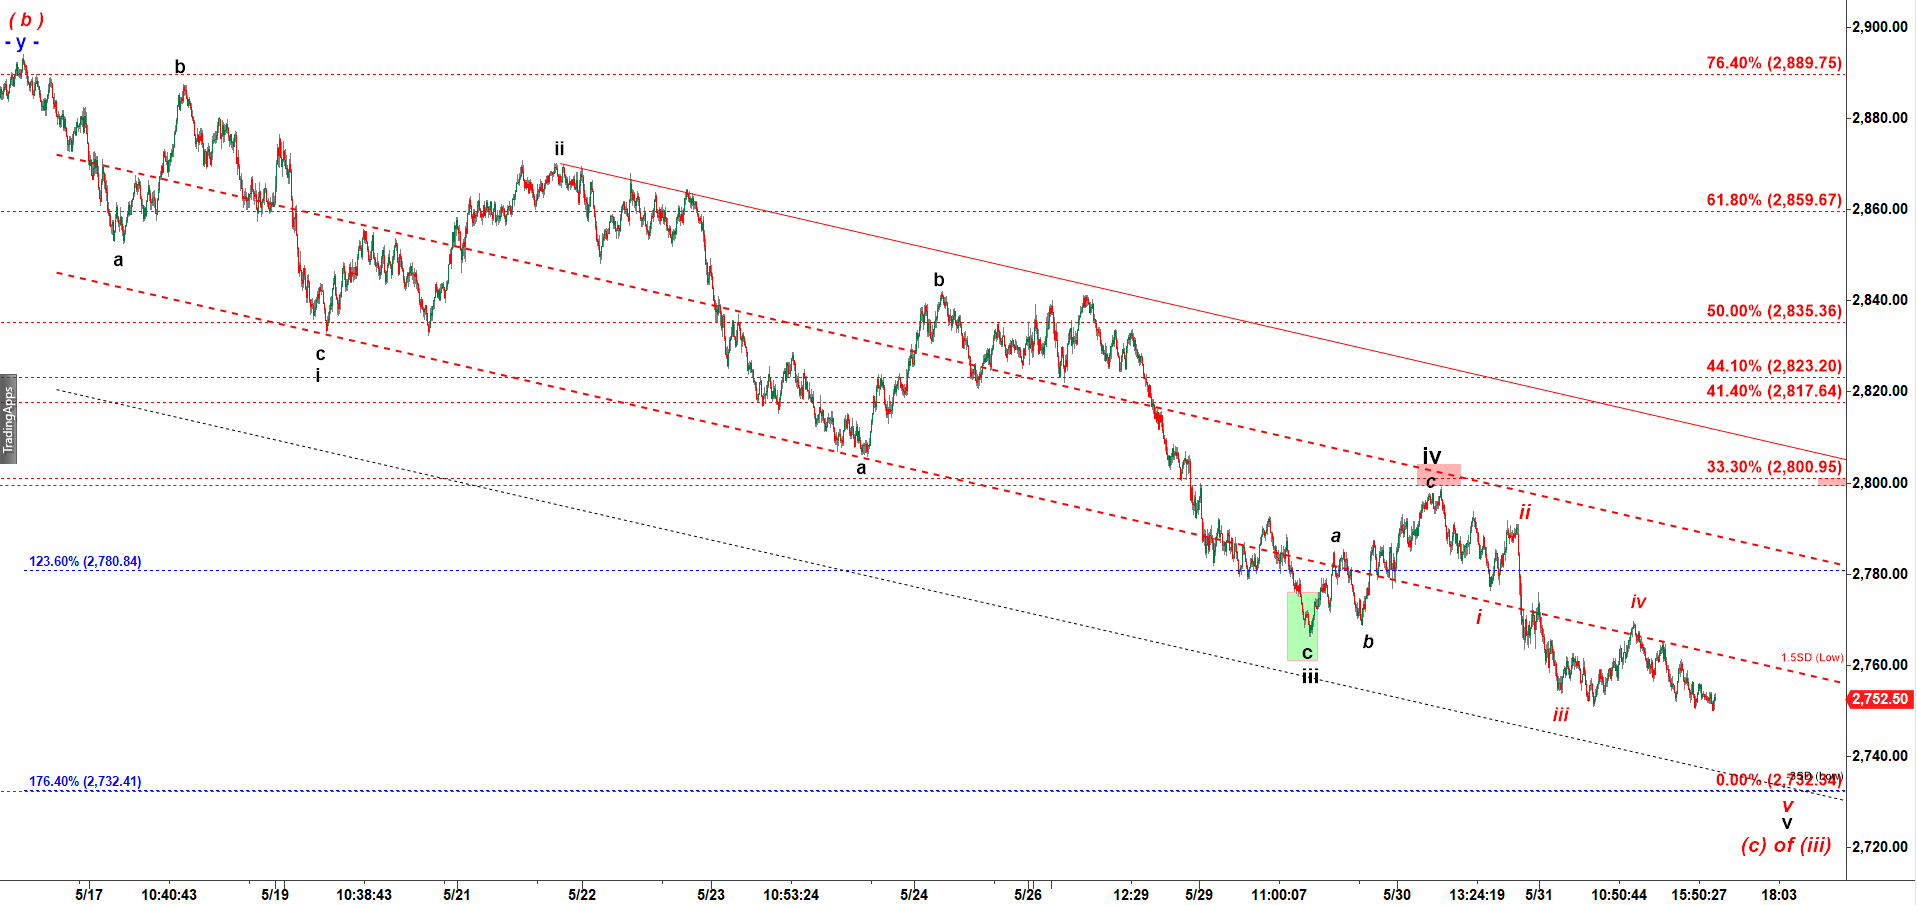
Subscription: Access to Micro Counts of US indices

ES - we may get a corrective rally in wave ( iv ) up

If we look at 90 min chart ( below ) we can see ES may stretch lower in the current wave ( c ) of ( iii ) before a pullback in wave ( iv ) up.

ES - 90 min chart updated at 5:42 PM on 6/2/2019

Now let’s zoom -in to 4,500 tick bar chart. We can see that 2,732 is a good target for a bottom of that wave ( c ) of ( iii ) 
and the following corrective wave ( iv ) up may get back up to 2,800.  

ES - 4,500 tick bar chart updated at 5:42 PM on 6/2/2019

Disclaimer

Previous posts:

No posts found.
© 2025 CastAway Trader • Built with GeneratePress