• Home
  • US Market Updates
  • Education
    • Beginners Video Course
    • Intermediate Video Course
      • Syllabus of the Course
    • Trading Like A Pro Video Course
    • Video Lesson of the Week
  • Blog
  • Chat Room
  • Pricing
  • FAQ
Menu
  • Home
  • US Market Updates
  • Education
    • Beginners Video Course
    • Intermediate Video Course
      • Syllabus of the Course
    • Trading Like A Pro Video Course
    • Video Lesson of the Week
  • Blog
  • Chat Room
  • Pricing
  • FAQ

Subscription: Access to Micro Counts of US indices

ES - micro - as long as 2,870 support holds it can make one more push to 2,900 - 2,910

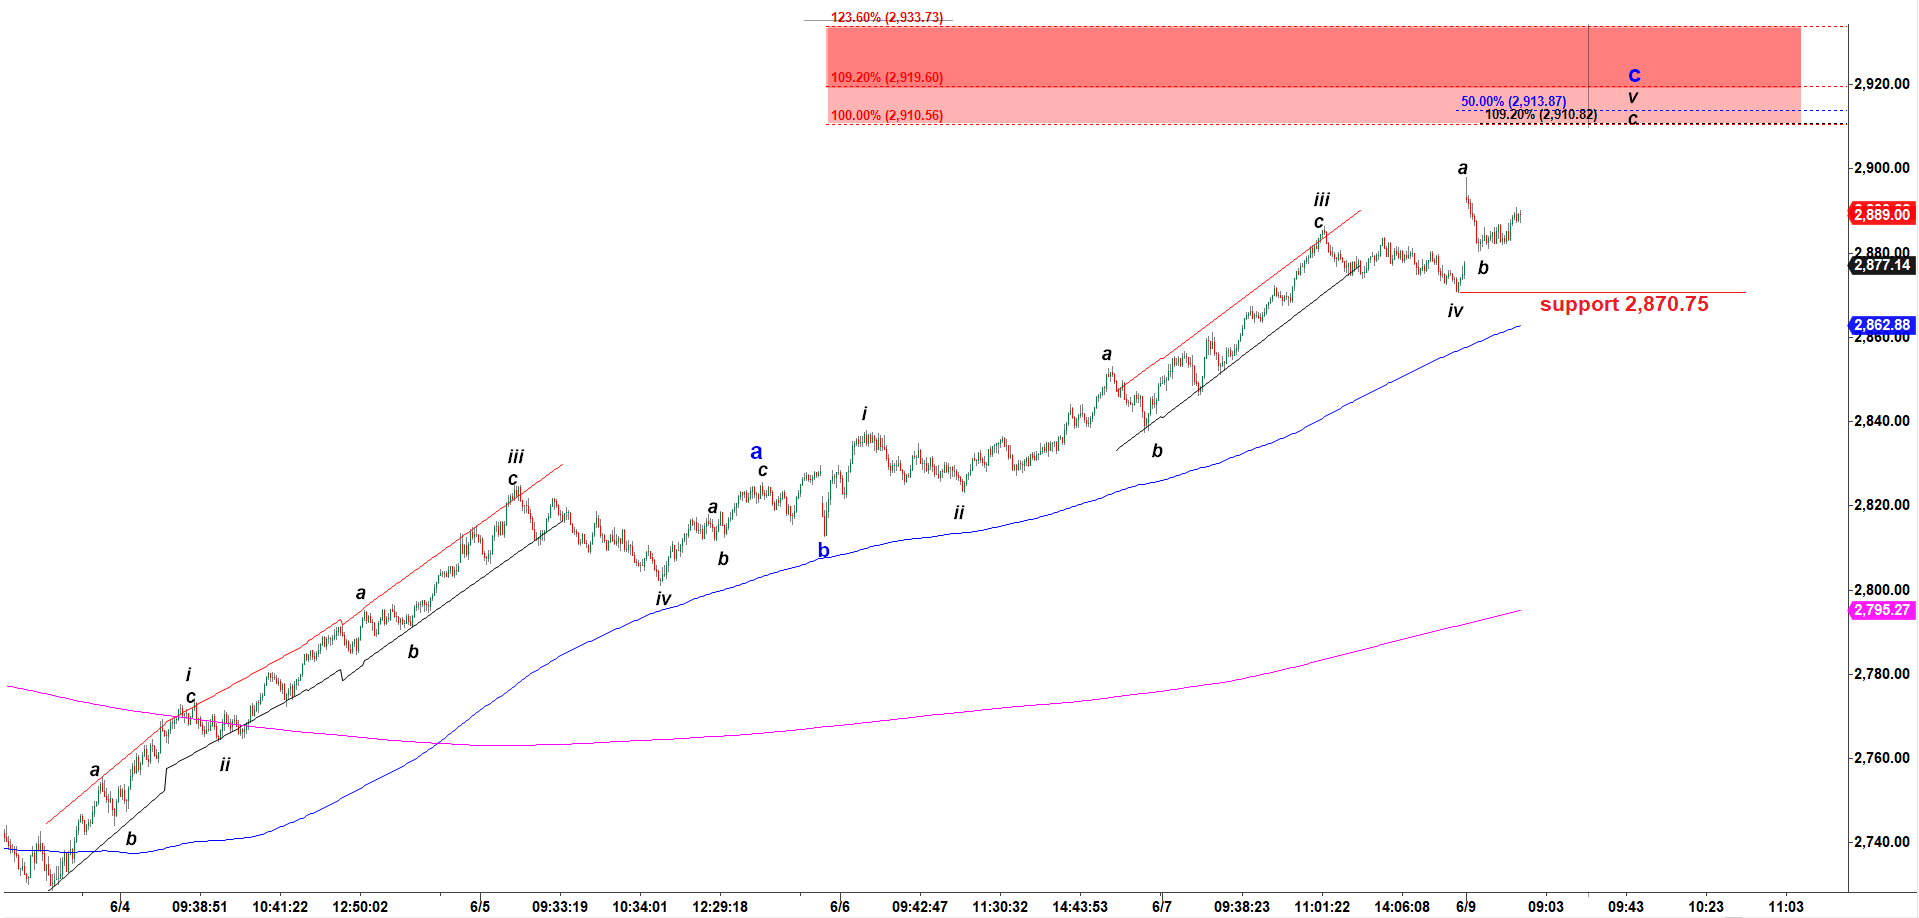
If I look zoom-in to 4,500 tick bar chart and look at the rally off the low made on 3 June 2019 I can get any impulsive five wave structure. It clearly looks like a-b-c structure.
We may be in the final squiggles of that move up.
As long as support 2,870.75 holds we may get another push higher to 2,910 – 2,920.

ES 4500 tick bar chart updated at 8-50 AM on 6-10-2019

Disclaimer

Previous posts:

No posts found.
Tags
$ES $SPX a-b-c- up pullback a-b-c up Bearish reversal Bear Market Rally Bitcoin Bottoming Breakdown breakout Bullish Wedge corrective pullback Crude Oil Daily Double Three DXY ES Expanded Flat Expanding Triangle failed breakdown failed breakout Green Box Head and Shoulders i down - ii up setup Inverse Head and Shoulders i up - ii down setup Macro micro Month Opening Range NQ one more higher high Red Box RTY Running Flat S&P short setup SPX topping toppying trading setup triangle Triple Three weekend Weekly YM
Read my Blog

  • My Account
  • Login
Hestia | Developed by ThemeIsle