Subscription: Access to Micro Counts of US indices
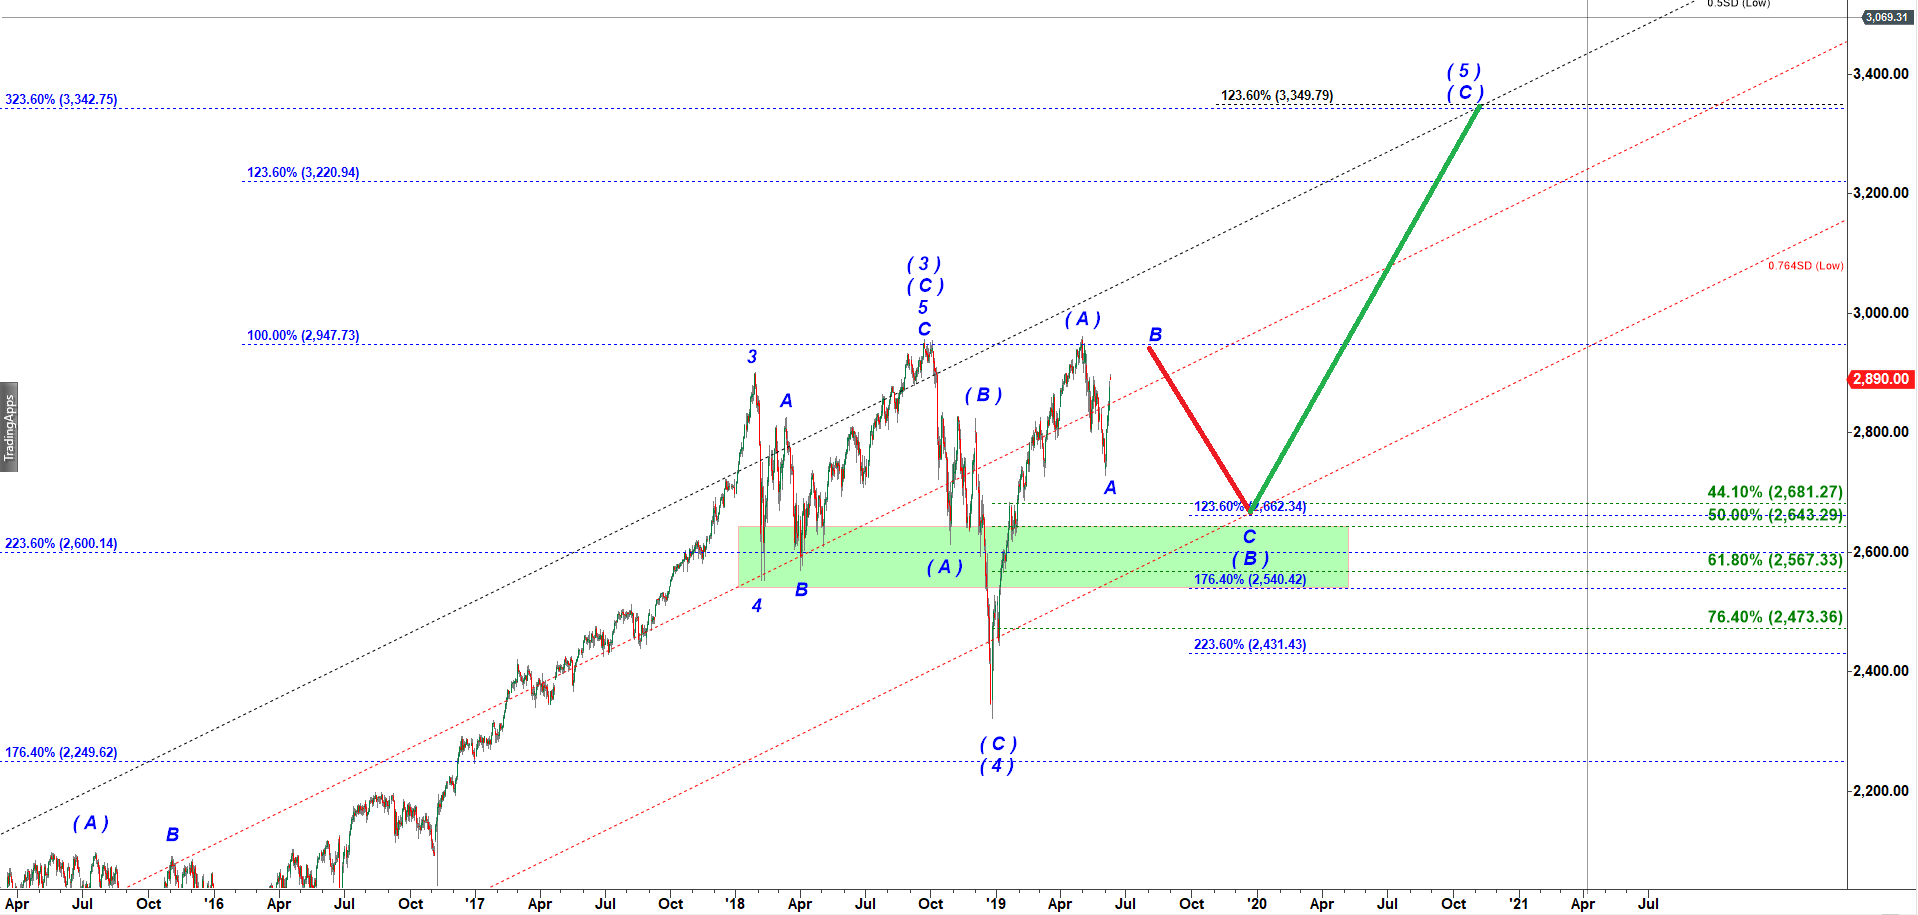
ES - Daily - this rally makes me very bearish
Folks, you know I believe that each wave has own characteristics because every wave has its own composition of investors with different personalities.
And that is why different waves have different “look”. The look is defined by a slope of ascent or descent as well as number of pullbacks. When I see that vertical rally my first association is this is exactly how wave B up looks like.
And that is why different waves have different “look”. The look is defined by a slope of ascent or descent as well as number of pullbacks. When I see that vertical rally my first association is this is exactly how wave B up looks like.
When a corrective wave B up gets that strong? When it points in direction of the main trend. And the direction of the main trend has been up since the lows of 2009.
Now I want to show you a daily chart that fits that wave B up perfectly:
Now I want to show you a daily chart that fits that wave B up perfectly:
ES Daily chart updated on 6-9-2019
We have seen also called “Expanded Flat” structure very often over the course of previous several months. If you are subscriber of my video course you should
watch Lesson 63: “Expanded Flat and Lesson 68 “Wave B explained”.
That rally may target the very same top we saw on 1 May 2019. Moreover, it can make a little bit higher high. And then we may get a strong decline again in wave C down of ( B ) down
Let me show one of the recent Expanded Flat corrective structures in ES-mini ( 4 hour chart, March 2019 ):
Let me show one of the recent Expanded Flat corrective structures in ES-mini ( 4 hour chart, March 2019 ):
ES - 4 hour chart, March 2019
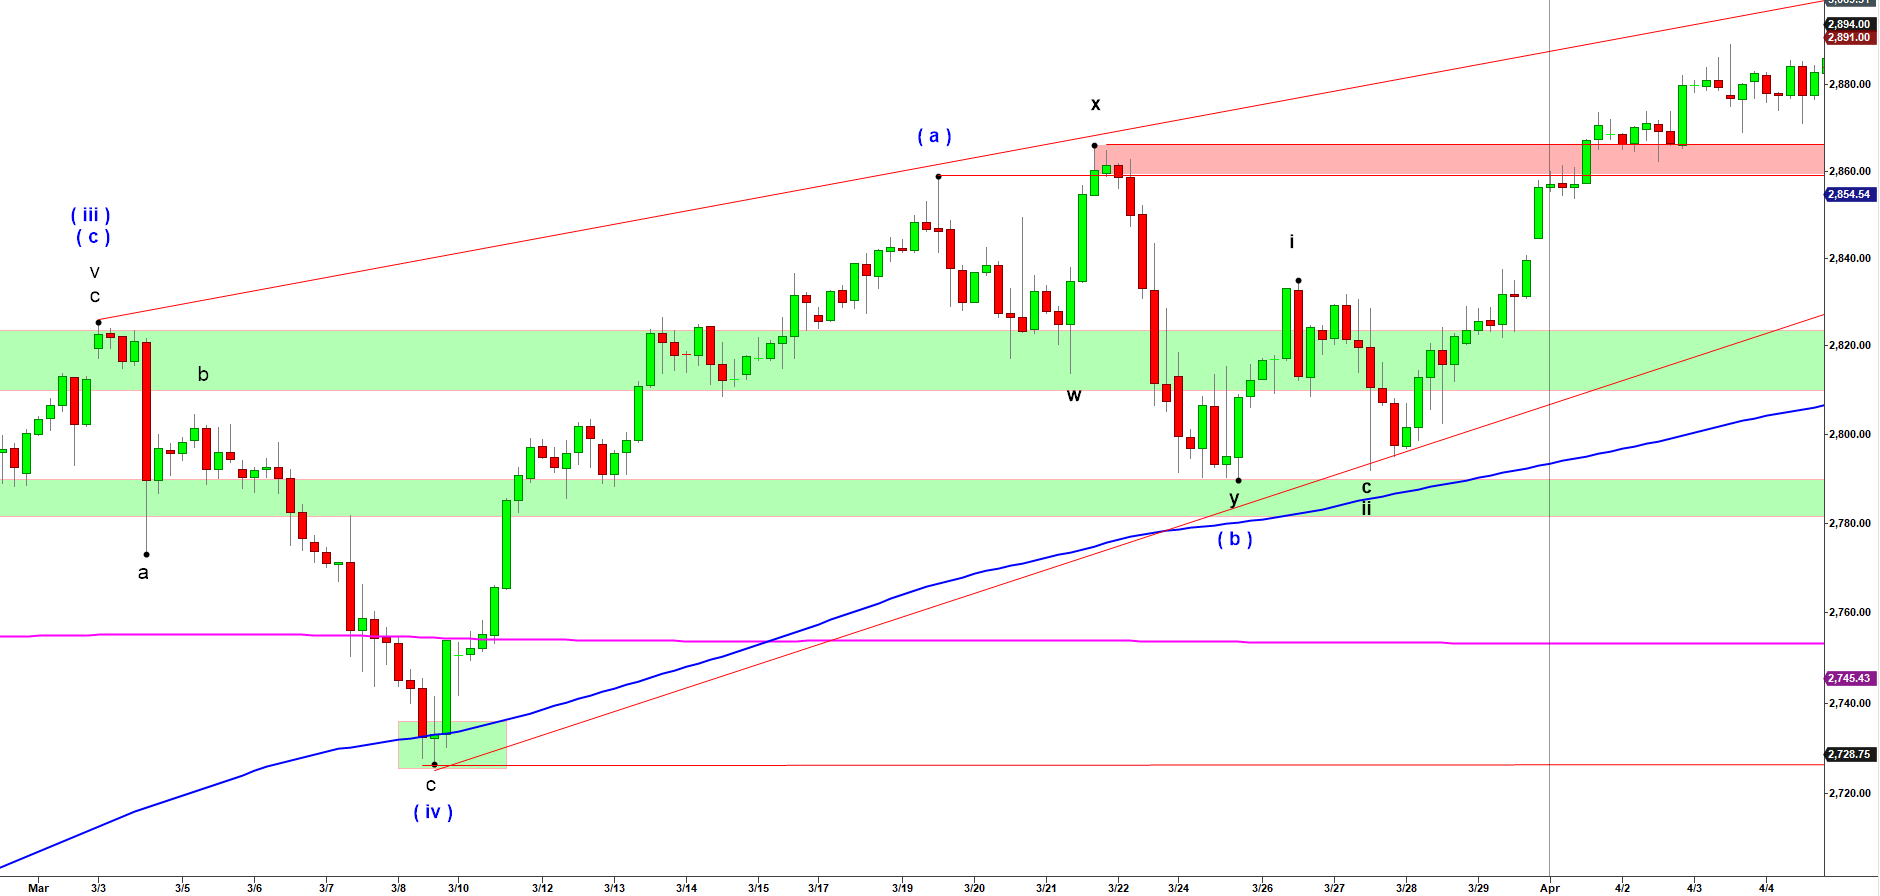
Look first at the top labelled as blue ( a ).
This is a kind of a top we have got on 1 May 2019
Then we have got wave w down (black label). I think that decline is comparable to decline in ES from 1 May 2019 top into the bottom on 3 June 2019.
Now comes the most interesting part! Look at that vertical looking rally in wave b up. Doesn’t it look similar to what we are having here in ES now?
Not only it looks super strong but it managed to make a new higher high over preceding top made by impulsive wave ( a ) of ( v ) up.
It made a slightly higher high and run all stops of bears only to immediately reverse and drop to a lower low in the final wave y of ( b ).
That second leg down in wave y = 176.4% of w down.
In our case that means wave C of ( B ) down (look at the first chart above ) may stretch to 2,550 after this crazy rally in wave B up of ( B ) down tops.
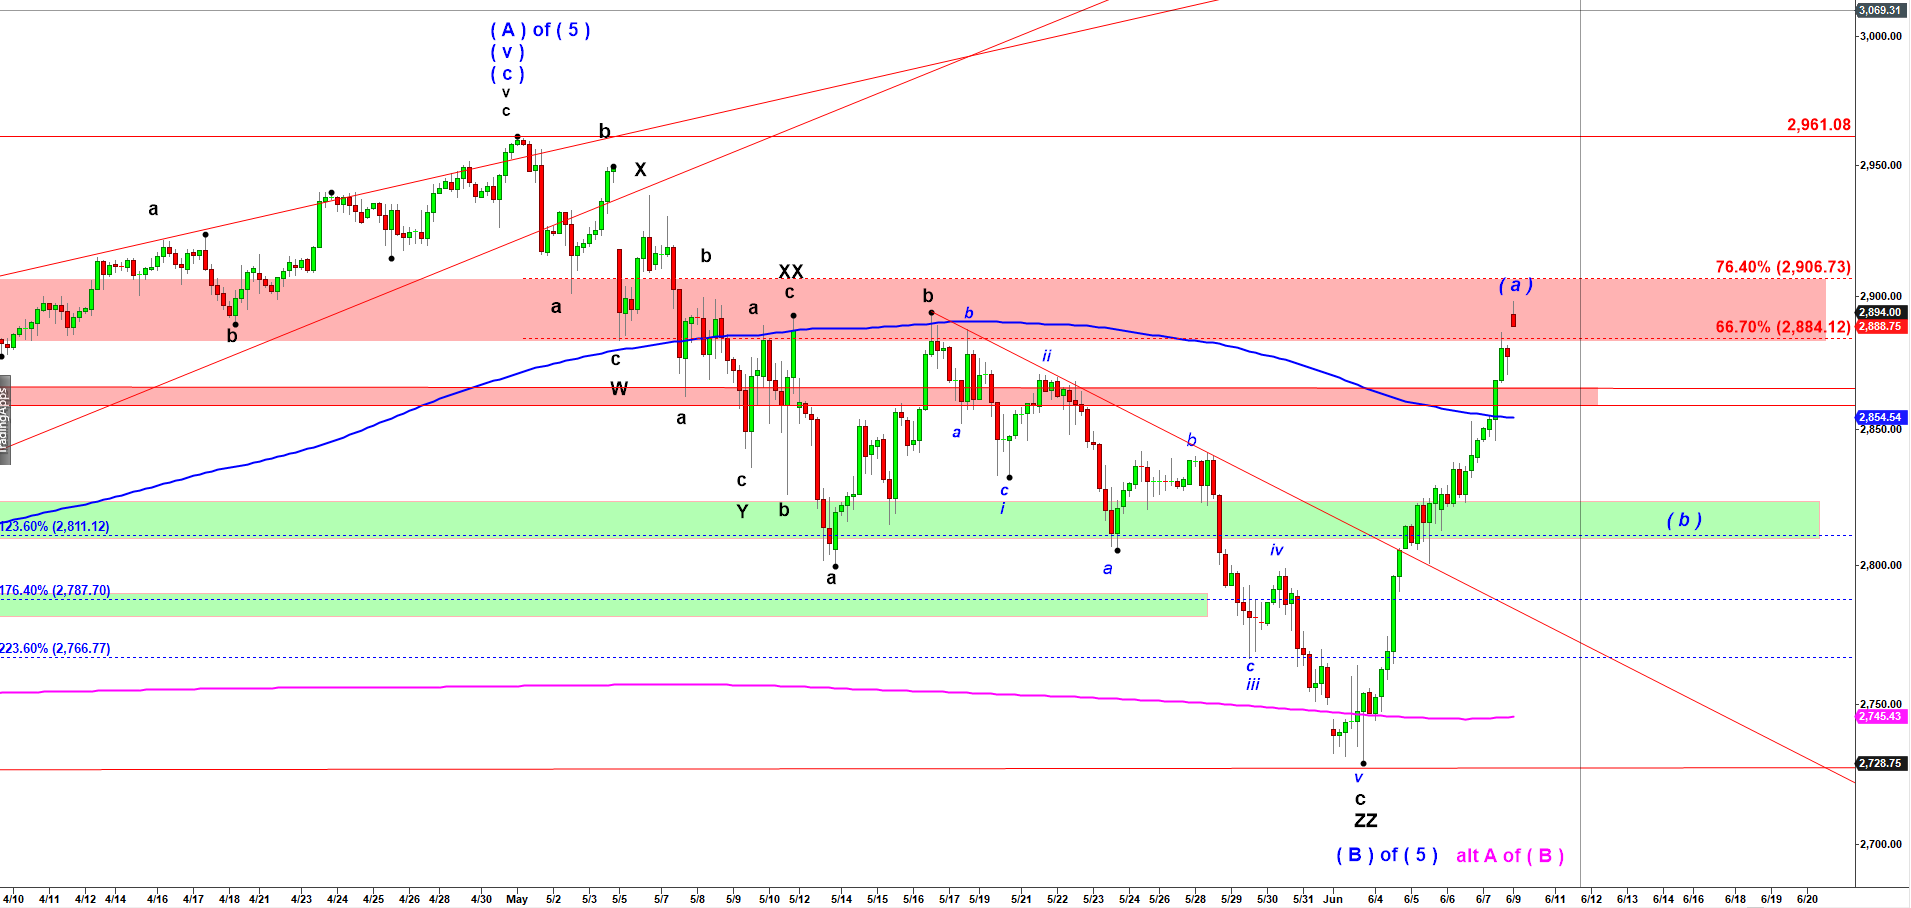
Now lets zoom-in to 4 hour chart:
Looking at 4 hour chart we see that ES opened with a gap up inside the Red Supply Zone. In general such gaps on Monday are not sustainable. If it holds until the open I will be a buyer of puts.
Now you should ask me how to align that wave B up on daily with that ( a ) up on 4 hour chart.
It’s very simple!
Wave B up on daily can not cover all that distance to the 1 May 2019 top in a straight line fashion.
It should be structured as (a) up – ( b ) down – ( c ) up.
I think the rally we have been watching the low on 3 June 2019 was wave ( a ) up of that Large B up on a Daily chart. And we should get a pullback in wave ( b ) down.
ES - 4 hour chart updated at 7-30 PM on 6-9-2019
Previous posts:
No posts found.