Subscription: Access to Micro Counts of US indices
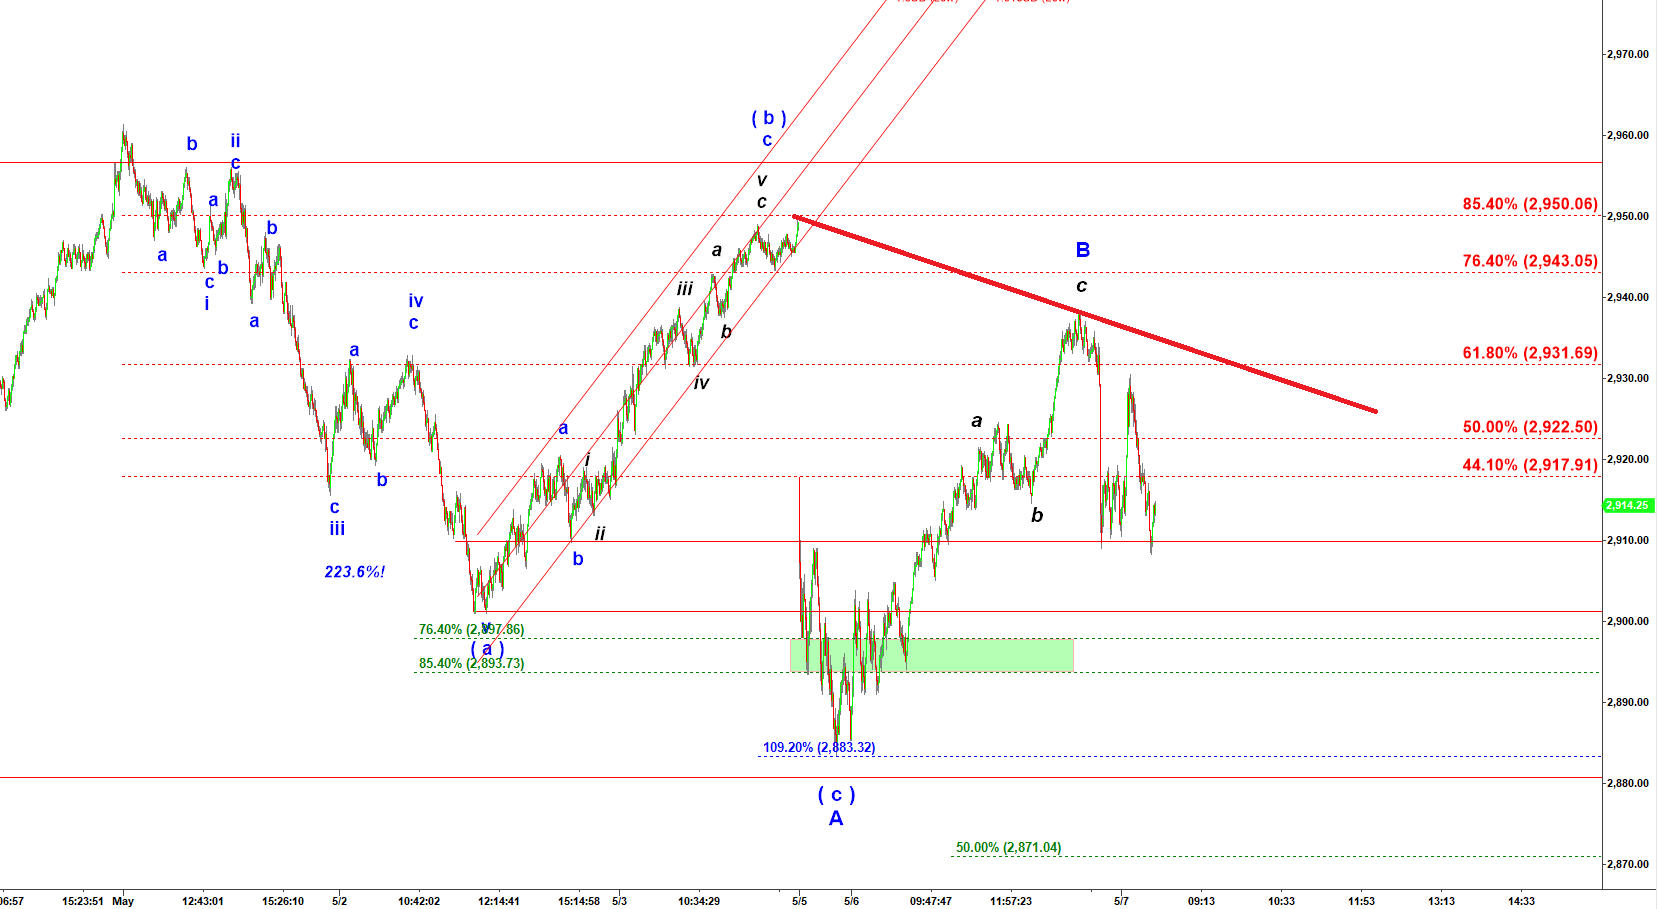
ES - now we have a sequence of lower highs
In the previous update I mentioned that “ES came back up to retest the broken bearish wedge from below”. That is normally a good bearish setup. And we got a quick drop resulted from that setup.
Again I should repeat what I wrote last time: “The micro structure of this rally is not clean. I keep counting this rally as a corrective wave ( b ) up after the first leg down in wave ( a ) down off the top.”
Now the key question is whether that wave ( b ) up is complete. There are good chances that it is complete and ES may start decline in wave ( c ) down from here. But there is an alternative “evil” scenario where ES may extent higher. Under that scenario that ( b ) up is structured as a-b-c, where we have got a up and b down and we are left with the final push higher in wave c of ( b ) up.
After that corrective rally in wave ( b ) up we should get another decline in wave ( c ) down.
That evil scenario bodes well with RTY charts where RTY needs time to extend higher to complete the structure of the large wave A of 5 ( the rally off Dec 2018 low ). Again, we deal in ES-mini with a corrective wave in the direction of the main trend (up). And that makes that pullback hardly predictable because wave B in direction of the main trend does not follow any specific pattern. If we get that extended wave ( b ) up retesting the recent highs that would be a high probability shorting setup.
ES mini - 120 min chart updated at 8:30 AM on 5/7/2019
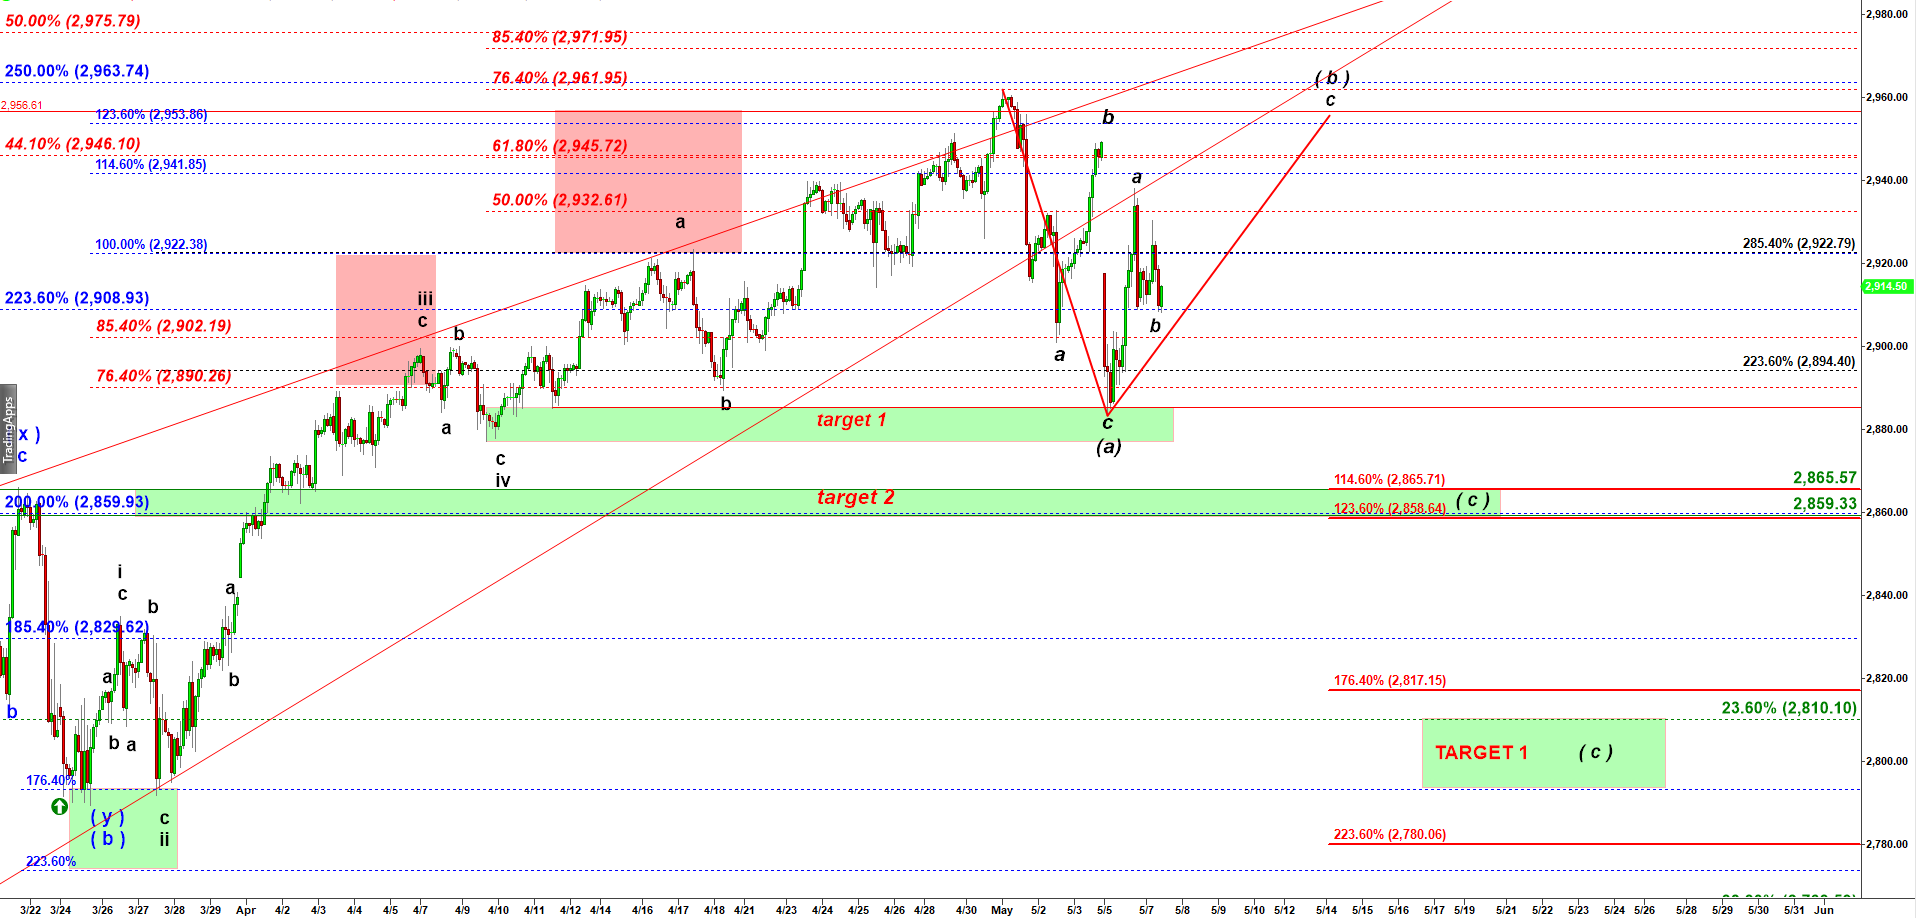
Looking at the micro count I can easily justify completion of the corrective rally. It keeps making lower high. But frankly speaking, I really like that “evil scenario” described above.
ES mini - 3,000 tick bar chart updated at 8:30 AM on 5/7/2019