Skip to content
  • Home
  • US Market Updates
  • Indicators
    • Impulse Master
    • Cycle Trader
    • GANN Levels
    • Subscribe
  • Education
    • Beginners Video Course
    • Intermediate Video Course
      • Syllabus of the Course
    • Trading Like A Pro Video Course
    • Video Lesson of the Week
  • Chat Room
  • Pricing
  • FAQ
  • My Account
  • Login

Subscription: Access to Micro Counts of US indices

ES - still holds a bearish setup

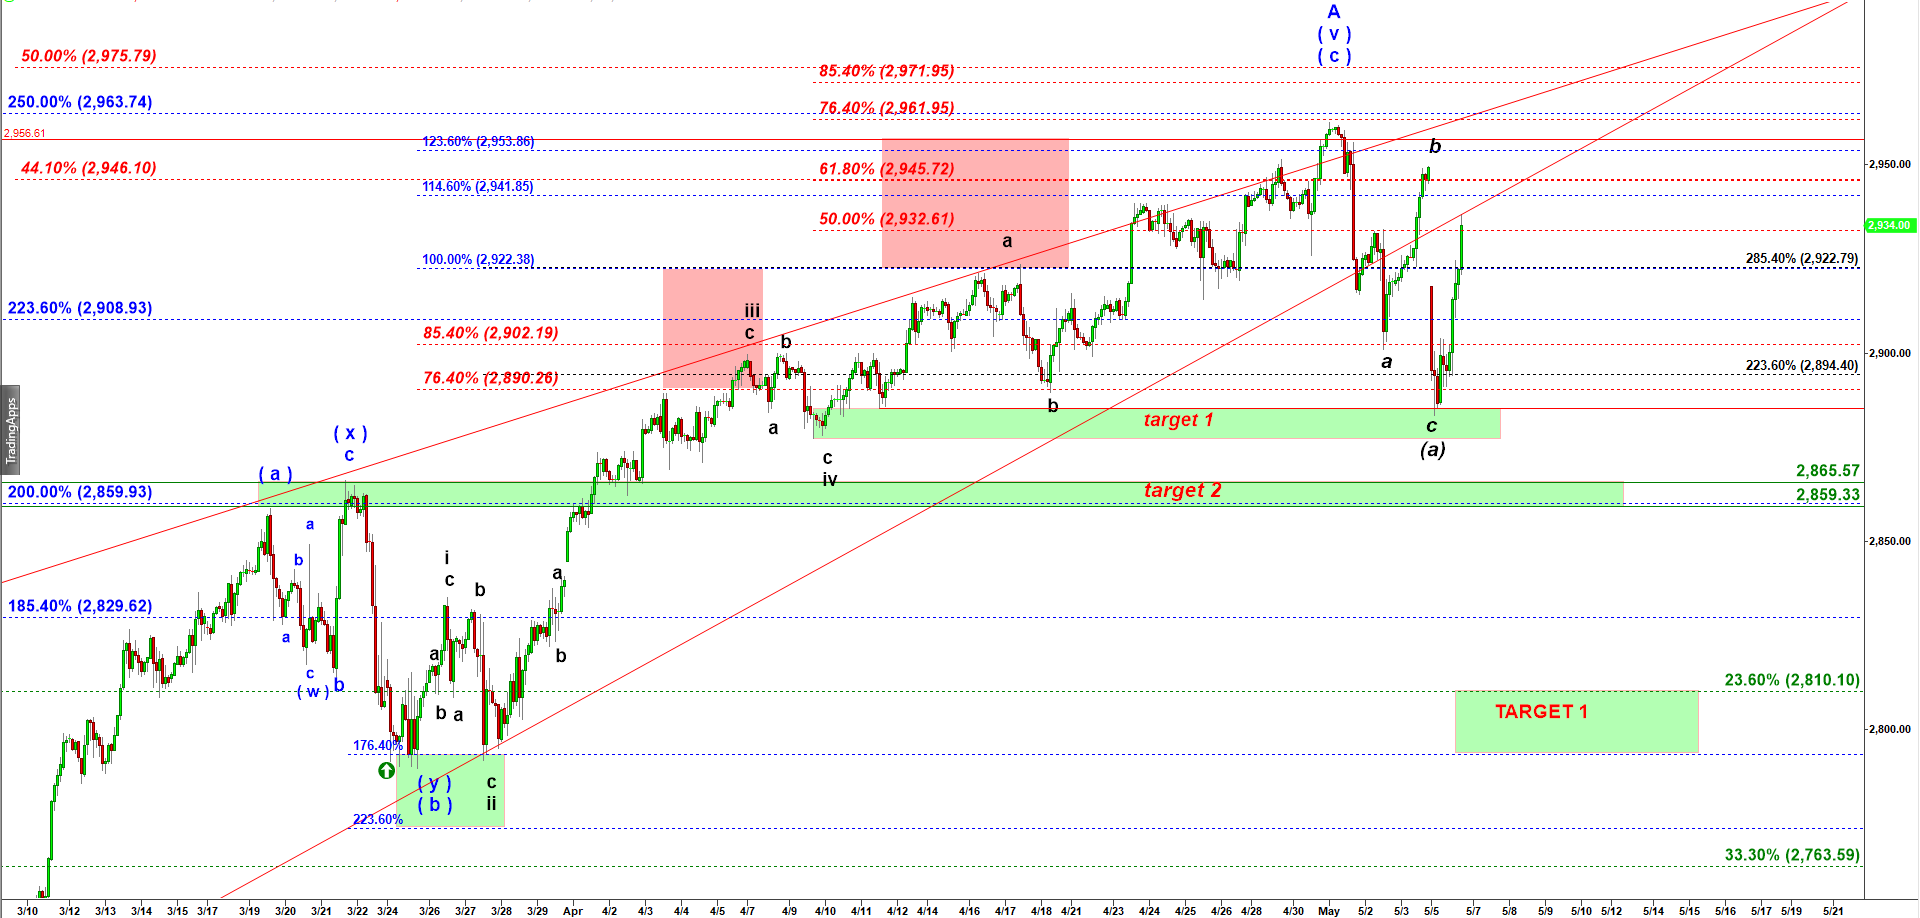
ES came back up to retest the broken bearish wedge from below. The micro structure of this rally is not clean. I keep counting this rally as a corrective wave ( b ) up after the first leg down in wave ( a ) down off the top. It can keep grinding to 2,946 to make a lower high while Russell will catch up and make a higher high it needed to complete rally off Dec 2018 low. After that corrective rally in wave ( b ) up we should get another decline in wave ( c ) down.

ES mini - 3,000 tick bar chart updated at 3:25 PM on 5/6/2019

No posts found.
© 2025 CastAway Trader • Built with GeneratePress