Subscription: Access to Micro Counts of US indices
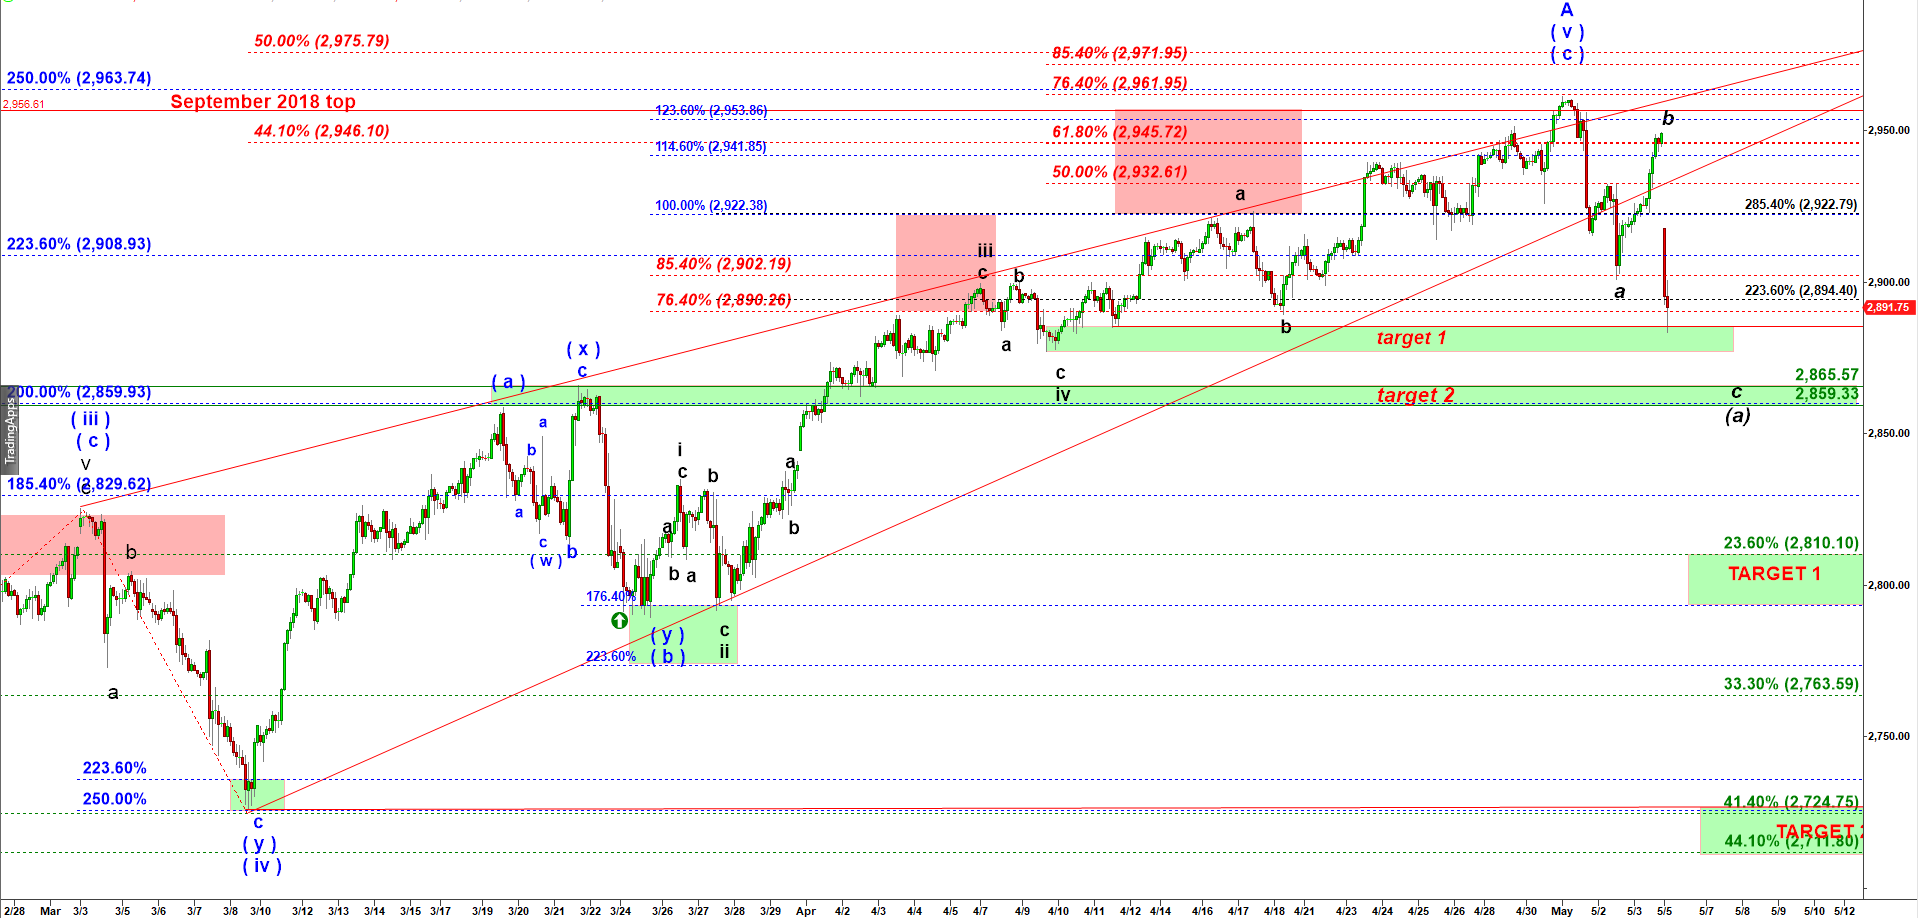
ES mini - is bottoming in micro wave iii down, but wave v may stretch to 2,860
You can remember that look, a look of a gorgeous bearish wedge. That is a high probability shorting setup! You can see that slope of the lower trendline is steeper, bulls keep buying out every pullback. And every pullback becomes smaller and smaller. But bears make a stand. They defend that upper trendline, again and again until the very final move make a fake breakout and fall down hard.
Now we are looking at that final wave c down of the first leg down in wave ( a ) down. That subwave c should have an impulsive structure and subdivided into five micro waves.This overnight drop is a clear micro wave iii down. Scroll down to see a micro count.
ES mini - 120 min chart updated at 10:02 PM on 5/5/2019
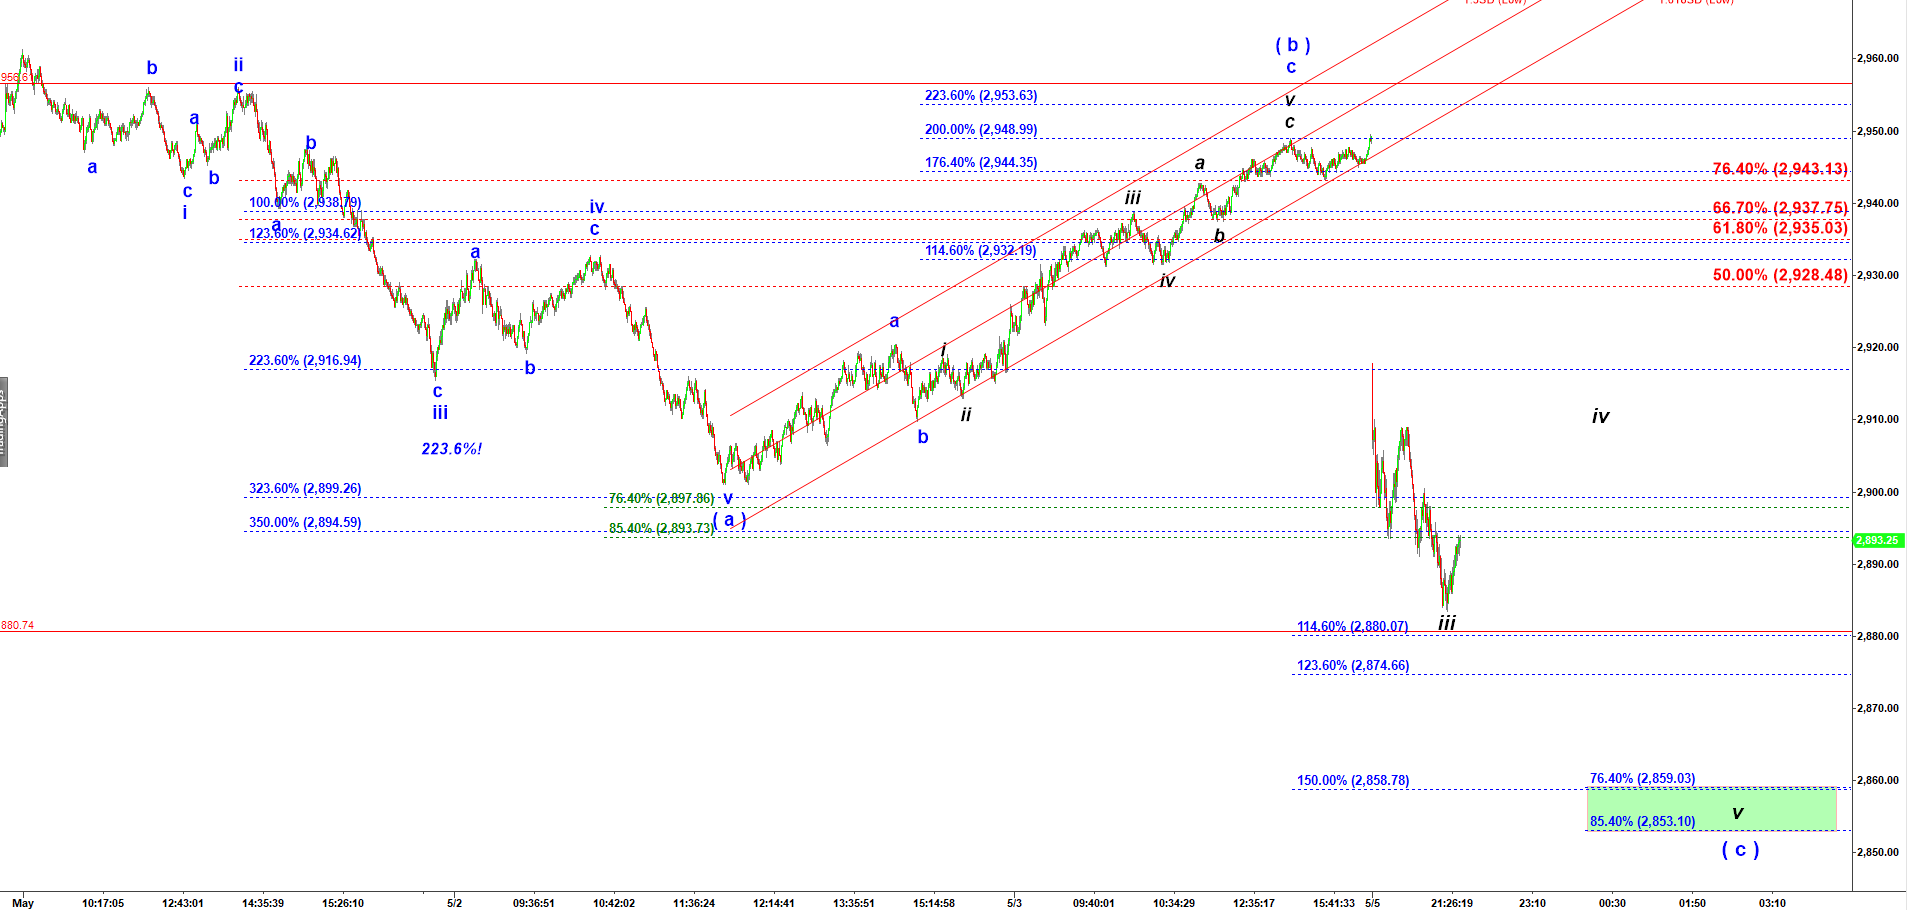
We need to get a corrective wave iv up followed by another drop to a lower low in the very final micro wave v. I see 2,860 as a high probability target for the bottom.That pullback in subwave iv up may go to 2,908 – 2,916.
ES mini - 1500 tick bar chart updated at 10:00 PM on 5/5/2019