Skip to content
  • Home
  • US Market Updates
  • Indicators
    • Impulse Master
    • Cycle Trader
    • GANN Levels
    • Subscribe
  • Education
    • Beginners Video Course
    • Intermediate Video Course
      • Syllabus of the Course
    • Trading Like A Pro Video Course
    • Video Lesson of the Week
  • Chat Room
  • Pricing
  • FAQ
  • My Account
  • Login

Subscription: Access to Micro Counts of US indices

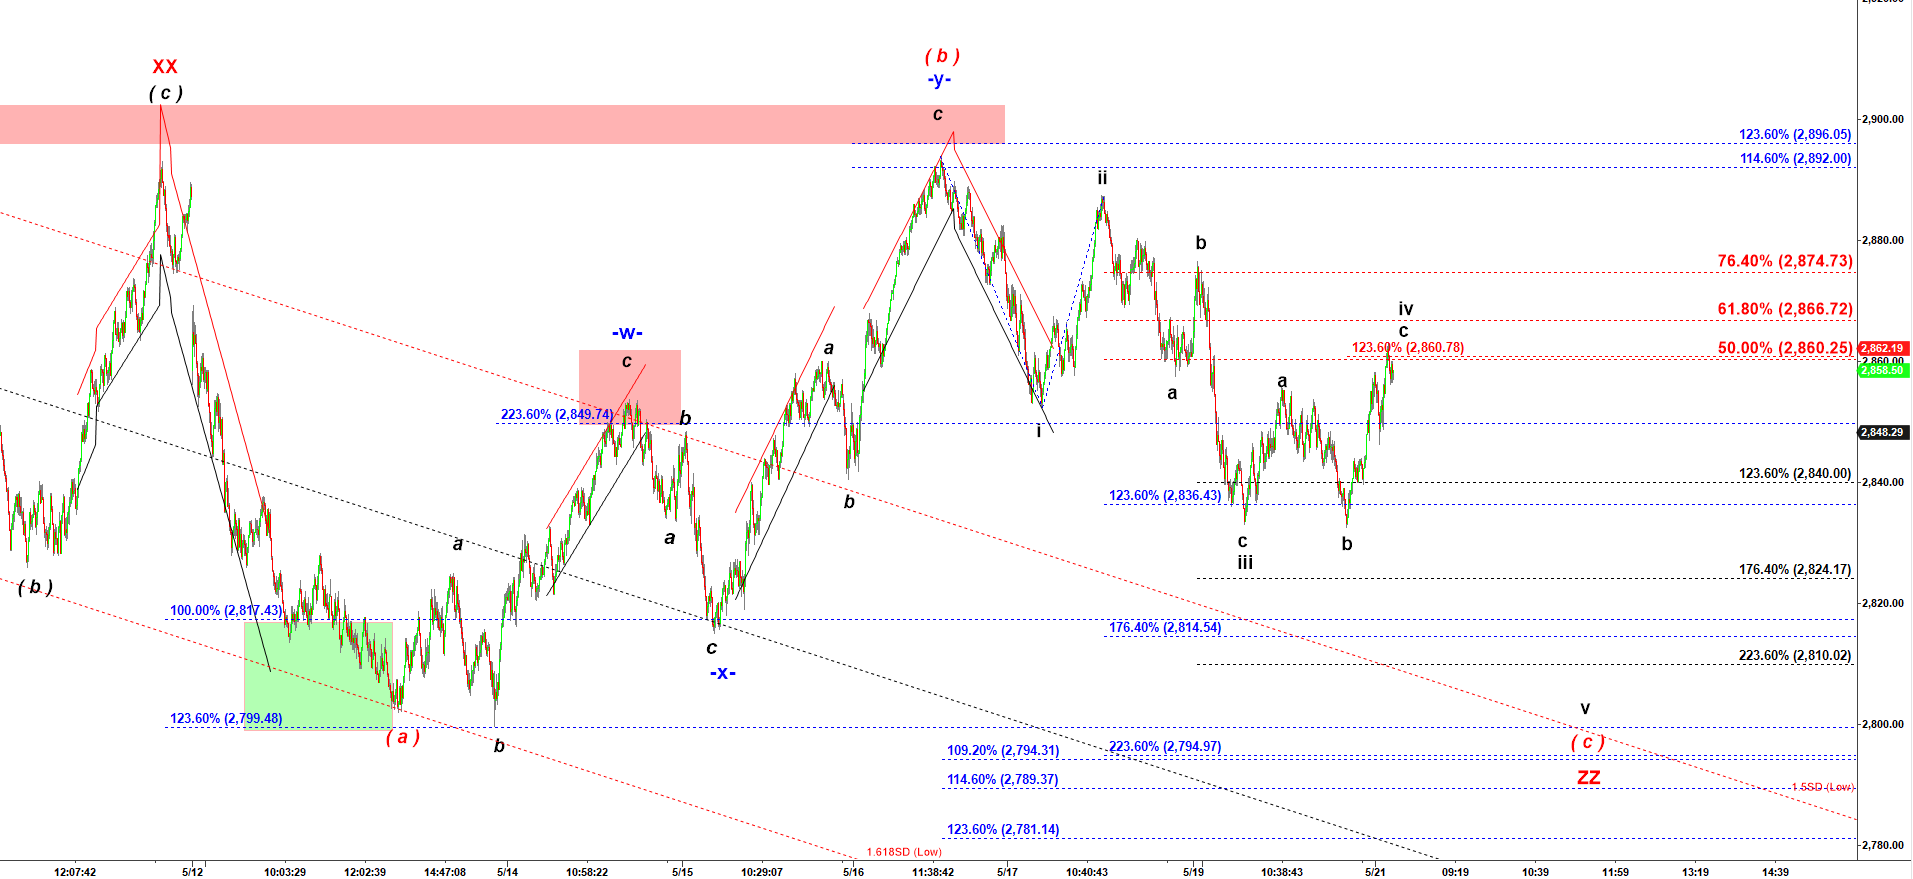
ES - holds the bearish setup

This move off the low in wave iv up retraced 50% of the drop in the preceding drop in wave iii.
That is a textbook retracement ratio for wave iv up. Moreover, c of iv = 123.6% of a of iv which is another textbook extension for wave c of iv.
That is why I consider this a bearish setup.
But if price keeps pushing higher over 2,867 it will not longer have that “perfect” bearish view. If price keeps moving higher the probability of the drop will significantly decrease.

ES - 4,500 tick bar chart at 8:26 AM on 5/21/2019

Disclaimer

Previous posts:

No posts found.
© 2025 CastAway Trader • Built with GeneratePress