Subscription: Access to Micro Counts of US indices
ES - the target 1 has been reached
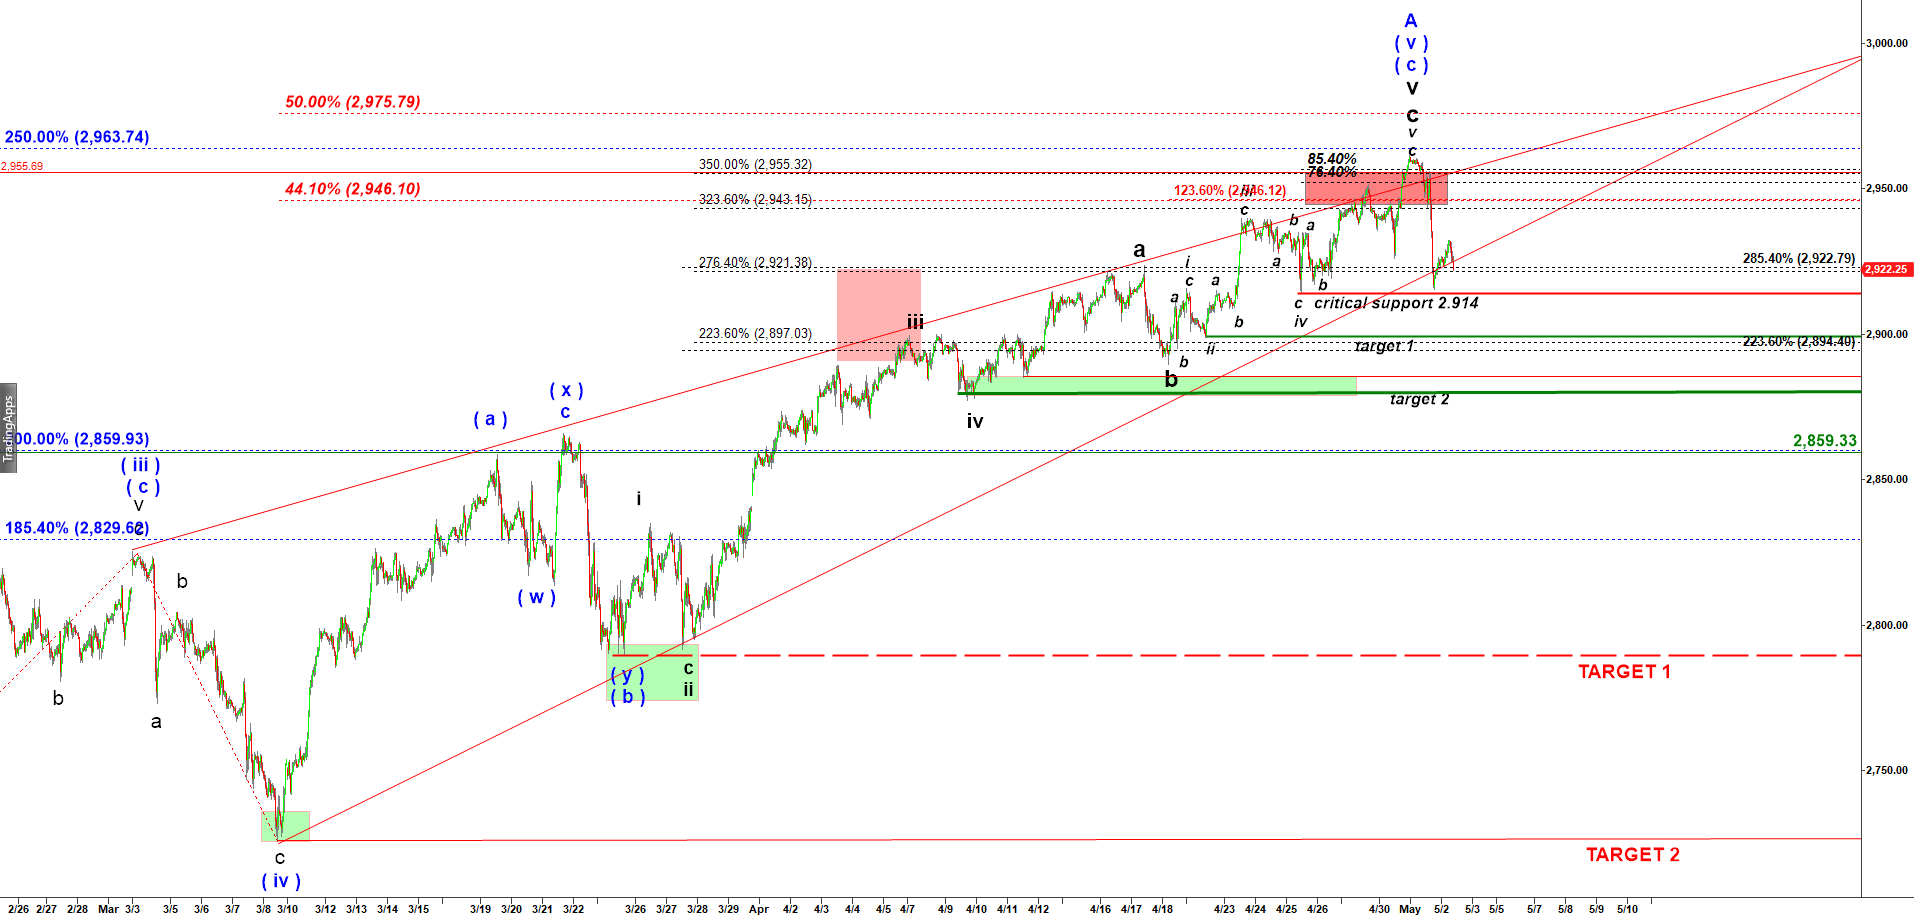
If you look at the chart posted in the previous update the first green target was at 2,899. So far ES has dropped to 2,901. See the updated chart below.
ES Mini - 45 min chart updated at 8:45 AM on 5/2/2019
On the updated 45 min chart we can see the drop has almost nailed the target 1. Now lets look even closer at the micro structure of this drop.
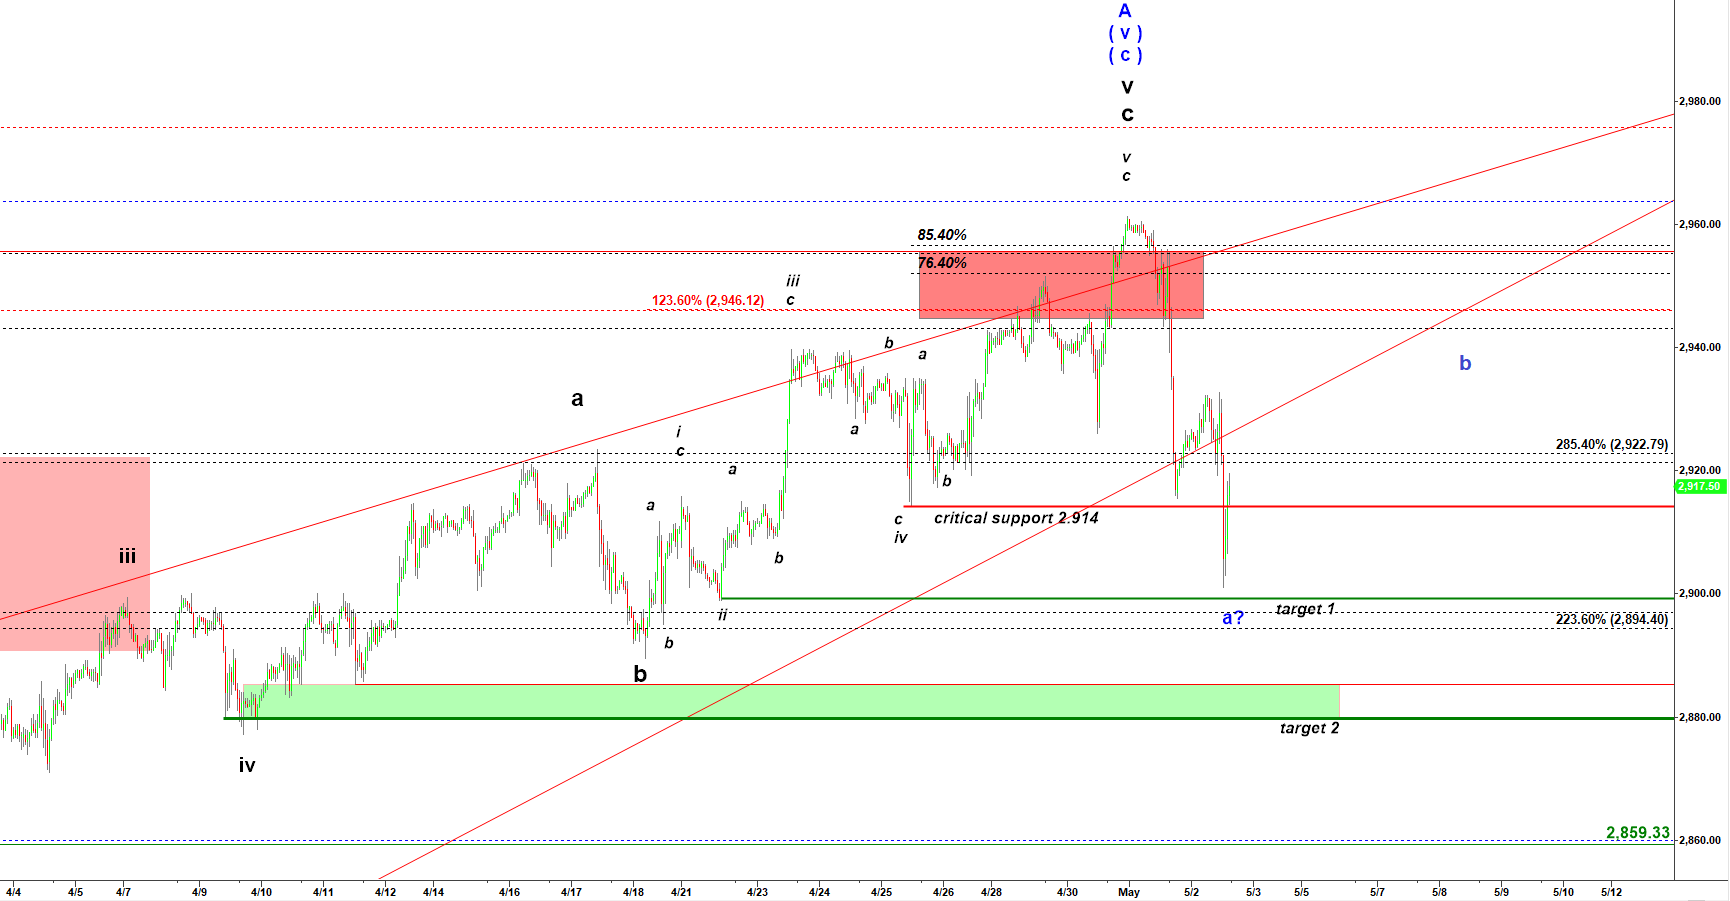
ES Mini - 45 min chart updated at 1:20 PM on 5/2/2019
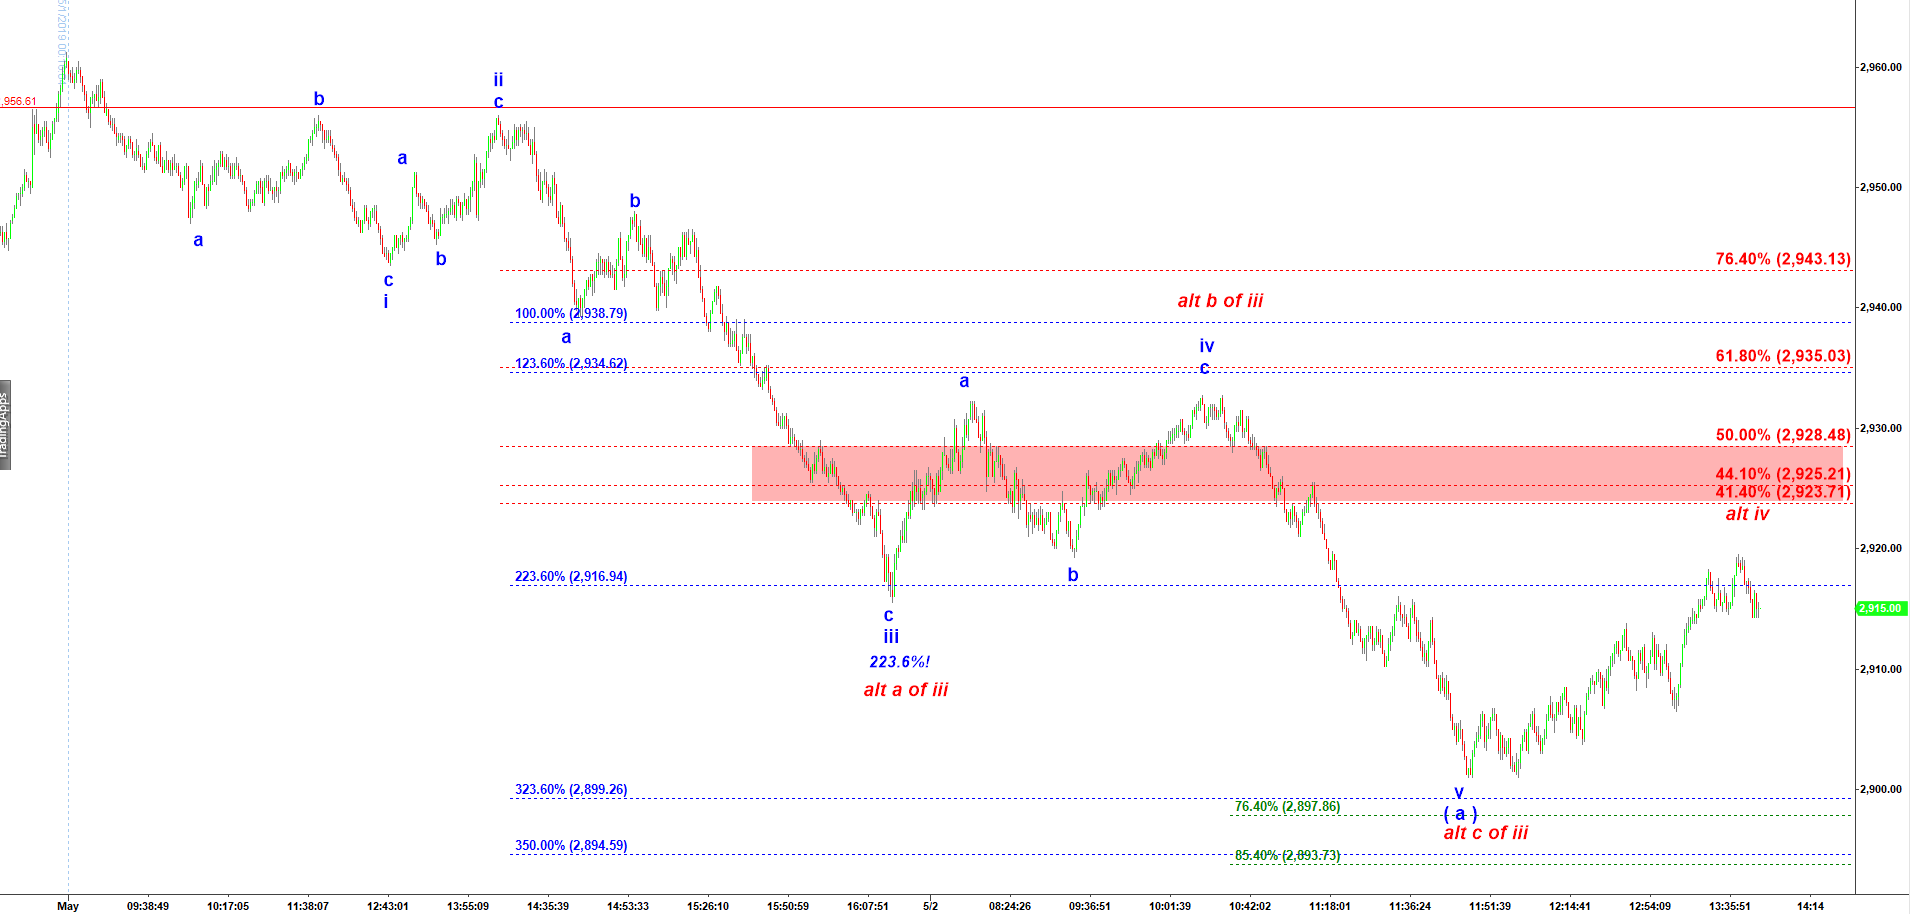
Looking at a micro chart (1,500 tick bar chart) I can press a count where the whole five wave down fractal in the first leg down in wave a has completed. That implies a pullback in wave b up has started. However, I like more an alternative red count where the last bottom was the bottom of wave iii down and now we see a pullback in iv up and we should get another move to a new lower low in wave v.
ES Mini - 1,500 tick bar chart updated at 1:20 PM on 5/2/2019