Subscription: Access to Micro Counts of US indices
ES - mini - no setup right here
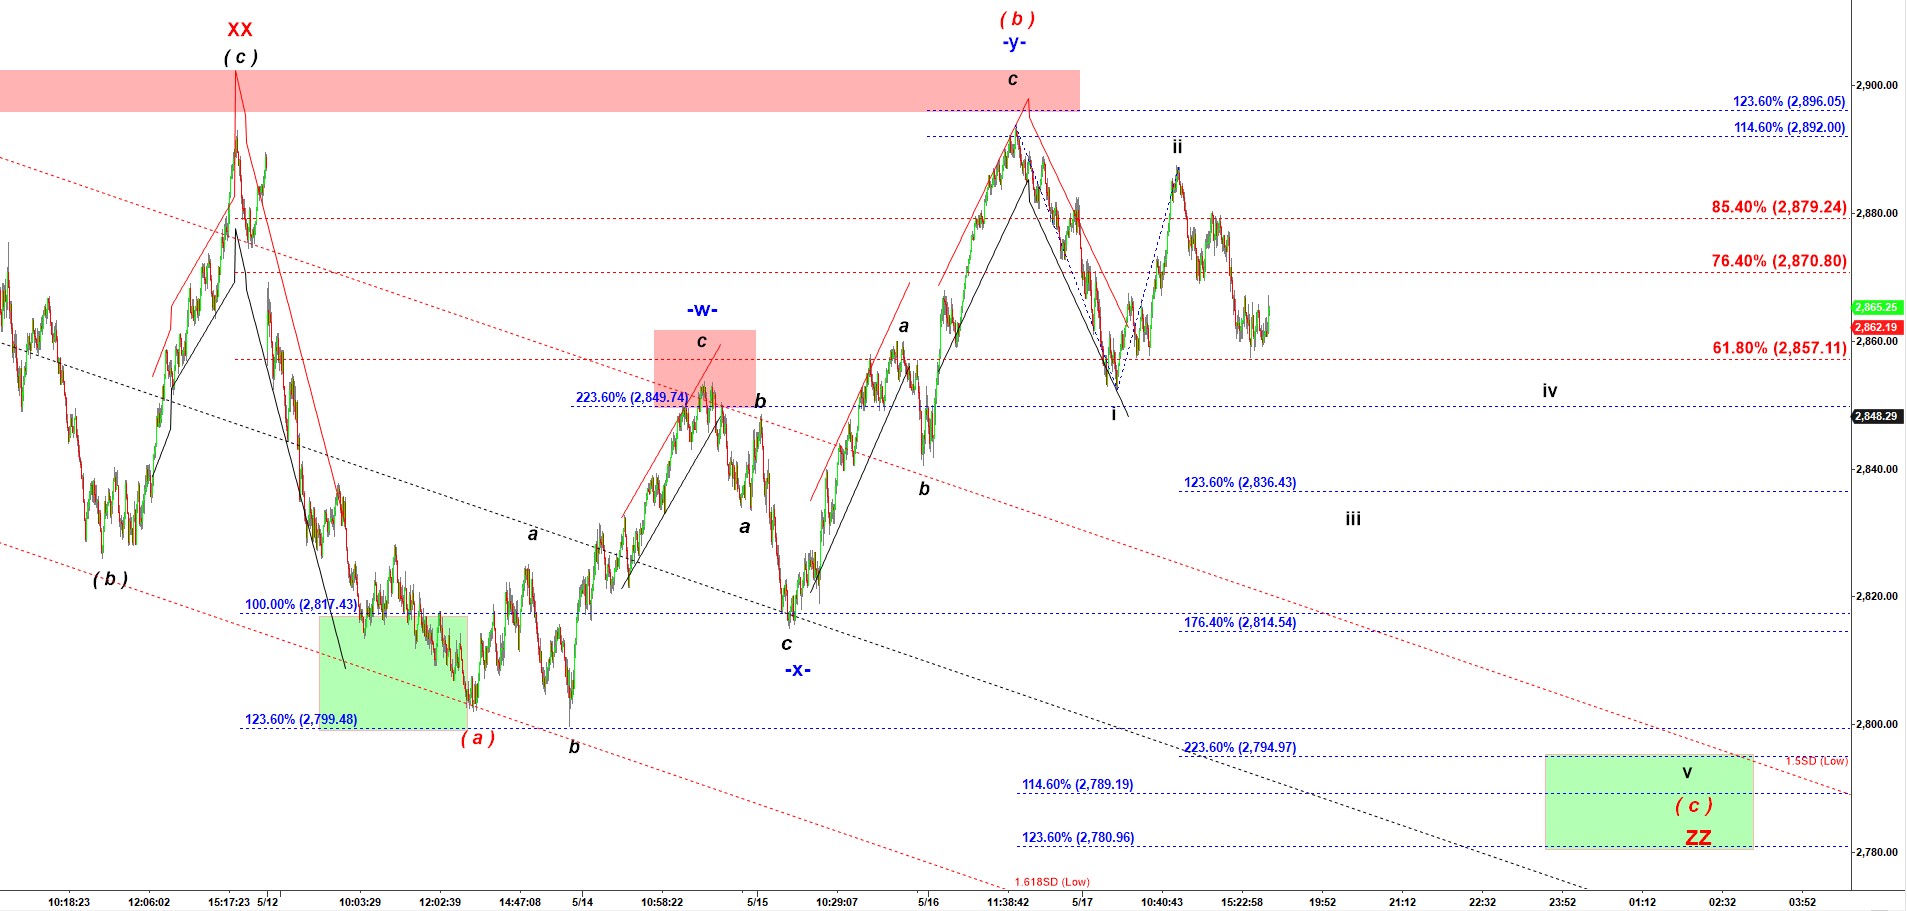
My macro count is still the same, the corrective Triple Three structure needs another, very final, push down to a new lower low under 2,800.
That drop in wave ( c ) down off that Red Target Zone on top (see the chart below) should be subdivided into five waves
I can count wave i down, followed by a pullback in a corrective wave ii up
Ideally it goes down from here to 2.846 – 2.844 in a wave a of iii followed by a pullback up in wave b of iii up.
That would be a SHORT setup because wave c of iii down should be a strong drop.
However, what makes me be critical to that bearish scenario is the fact that both NQ and RTY look having bottomed.
That is why ES may not play out that bearish scenario.
We need to keep watching to determine if ES is willing to keep following that bearish count I have described above. Nothing at this moment says it will not.
In any case I do not see a LONG setup for ES here . And I will see a SHORT setup if it goes lower in wave a of iii down as describe above and then plays a pullback in wave b of iii up.
ES - 4,500 tick bar chart at 7:10 PM on 5/19/2019