Skip to content
  • Home
  • US Market Updates
  • Indicators
    • Impulse Master
    • Cycle Trader
    • GANN Levels
    • Subscribe
  • Education
    • Beginners Video Course
    • Intermediate Video Course
      • Syllabus of the Course
    • Trading Like A Pro Video Course
    • Video Lesson of the Week
  • Chat Room
  • Pricing
  • FAQ
  • My Account
  • Login

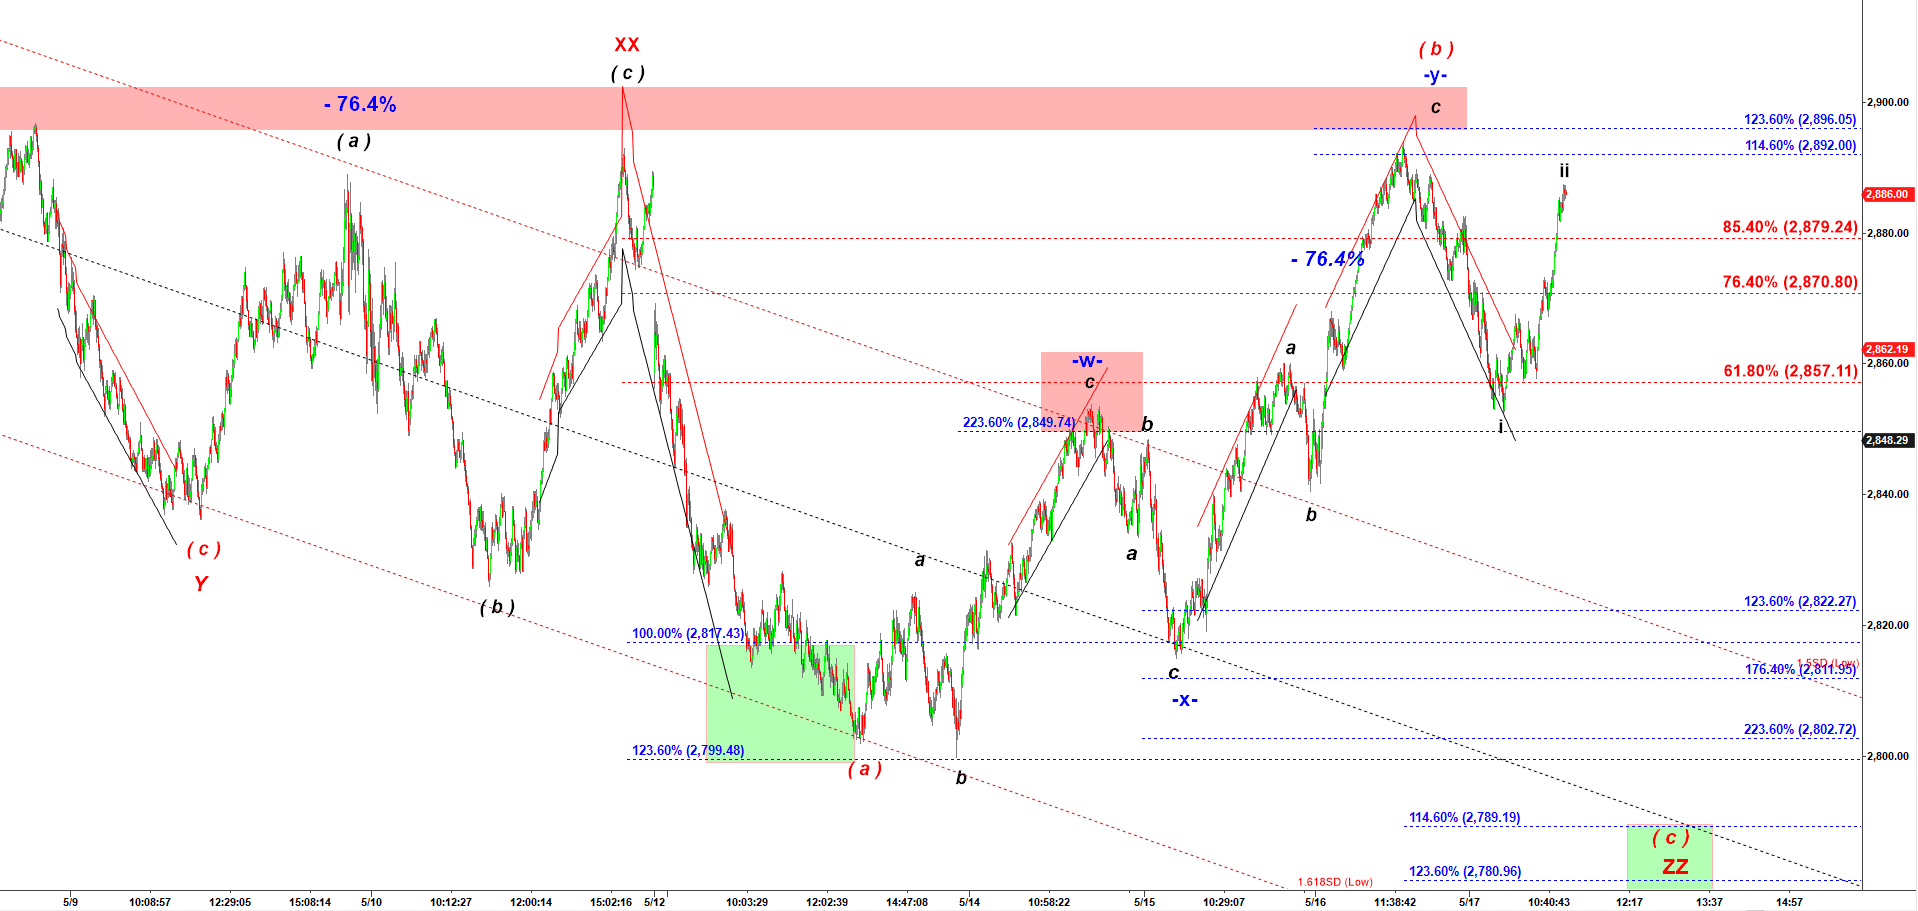
At 11:15 AM on Friday I send out the report below showing my subscribers a short setup. Back then Es traded at 2,886. During the following four hours ES was on a steady decline and closed the day at 2,860, 26 points lower.

Subscription: Access to Micro Counts of US indices

ES - a short setup with a tight stop

As long as ES stays under yesterday’s top it looks like a short setup with a tight stop
we got wave i down into open followed by a corrective rally ii up. From here it may start dropping again in wave iii down…

ES - 4,500 tick bar chart at 11:15 AM on 5/17/2019

Disclaimer

SUBSCRIBE NOW!
© 2025 CastAway Trader • Built with GeneratePress