Subscription: Access to Micro Counts of US indices
ES - let's talk about a bigger picture
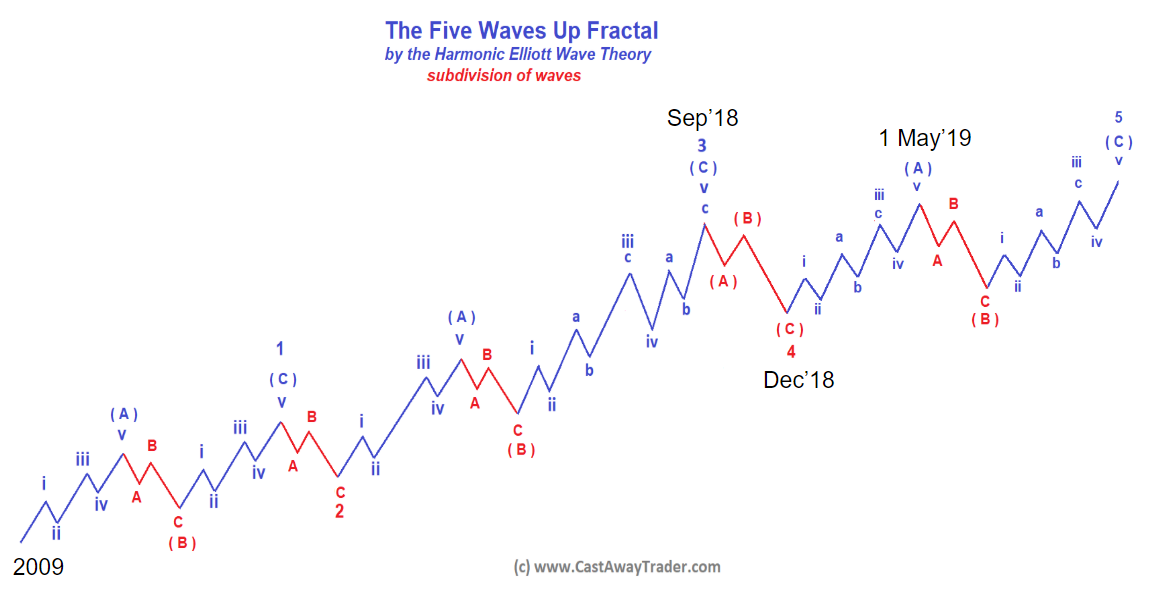
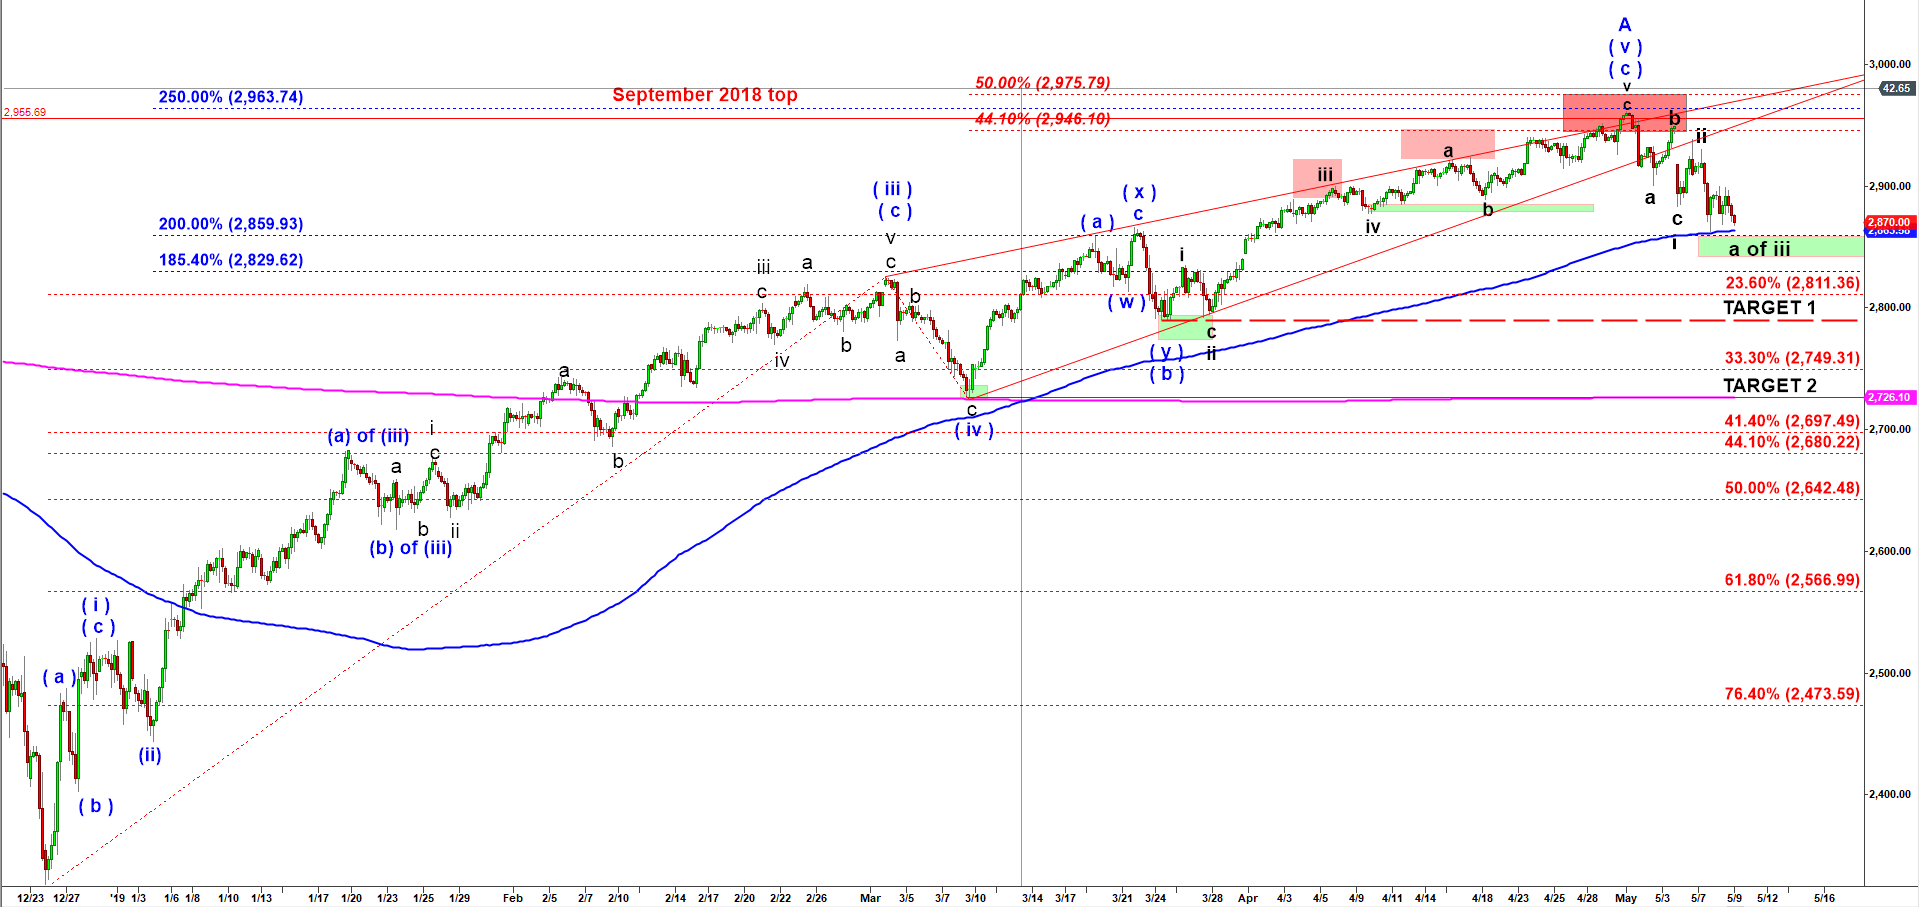
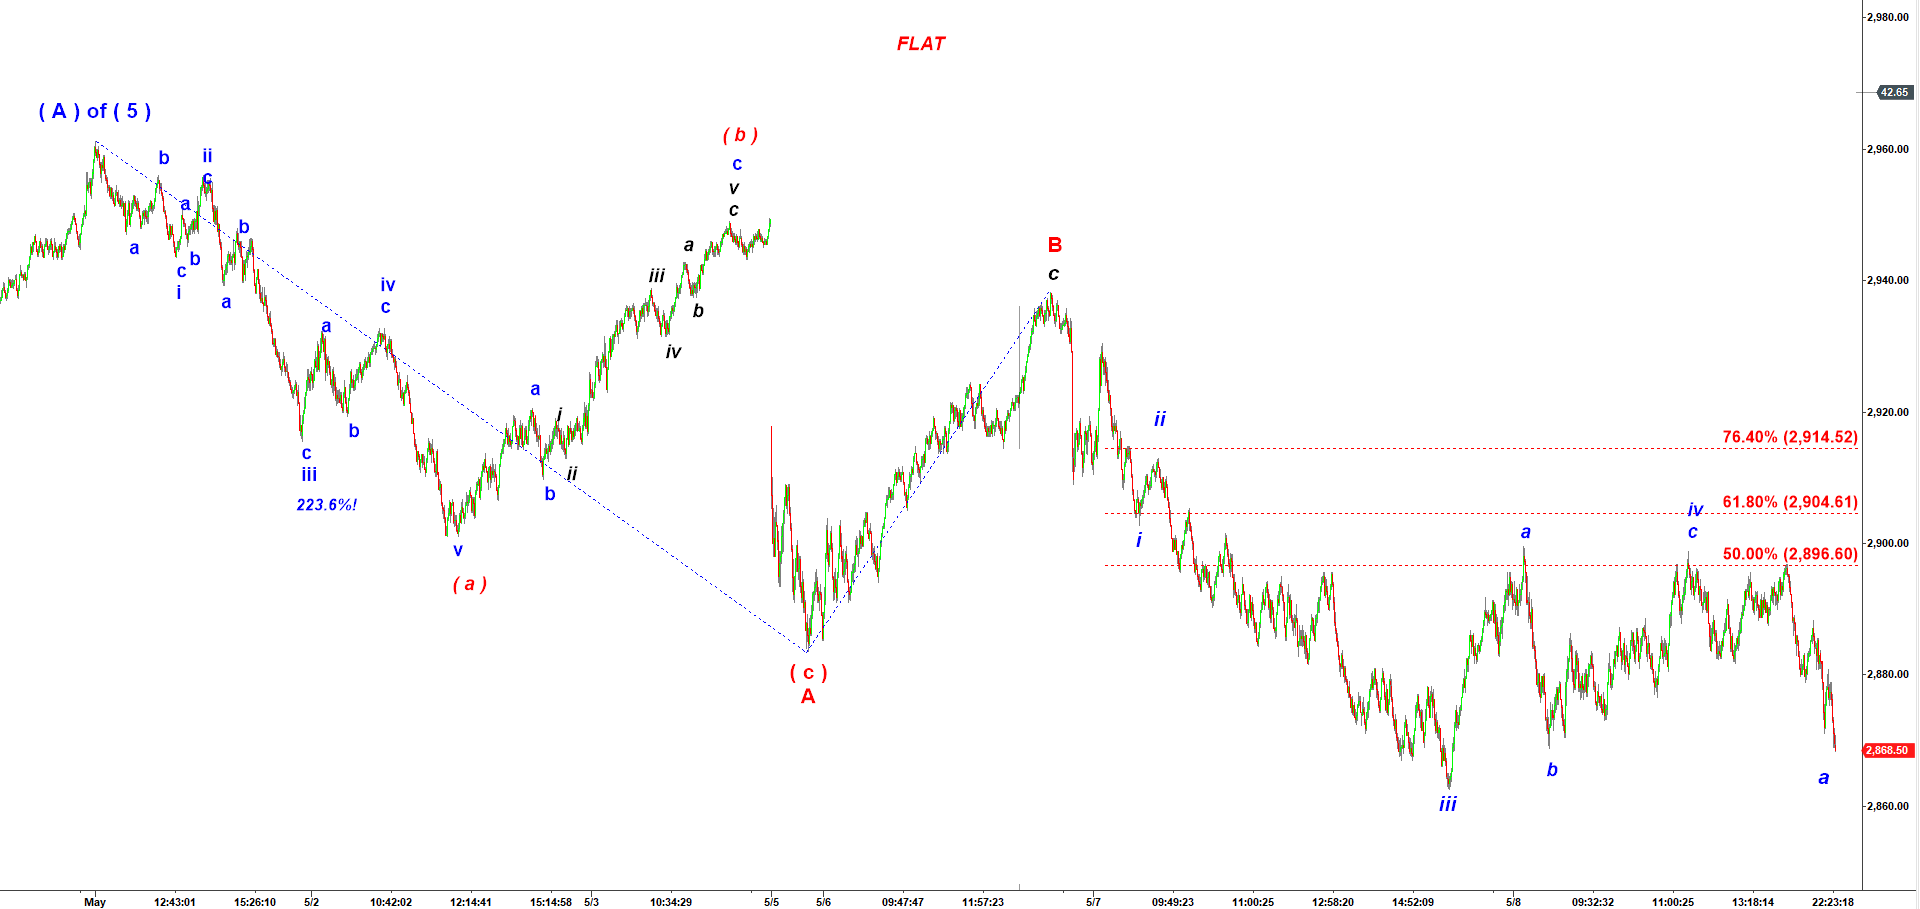
The Harmonic Elliott wave theory proposes that every trend follows the Five Wave fractal. Below you can see that foundational fractal aligned with the current position in ES. In my opinion, the rally in wave ( A ) of 5 started in December 2018 topped on 1 May 2019. Off that top we should get a corrective wave ( B ) down structured as A-B-C. To predict where that corrective wave ( B ) may find its bottom we should talk about its structure and potential retracement ratios to that completed rally in wave ( A ) up.
On the right side of the chart below you can see retracement ratios applied to the whole rally in wave ( A ) up started off the lows of December 2018.The minimum retracement is 23.6% ( 2,811 ). For a shallow pullback in wave ( B ) down 33.3% will be more suitable (2,750). The more common retracement will be 41.4% (2,700). That is the level where 1,000 MA on 120 min chart is currently located. And this is the most probable target for this correction.
ES-mini - 45 min chart updated at 11:55 PM on 5/8/2019
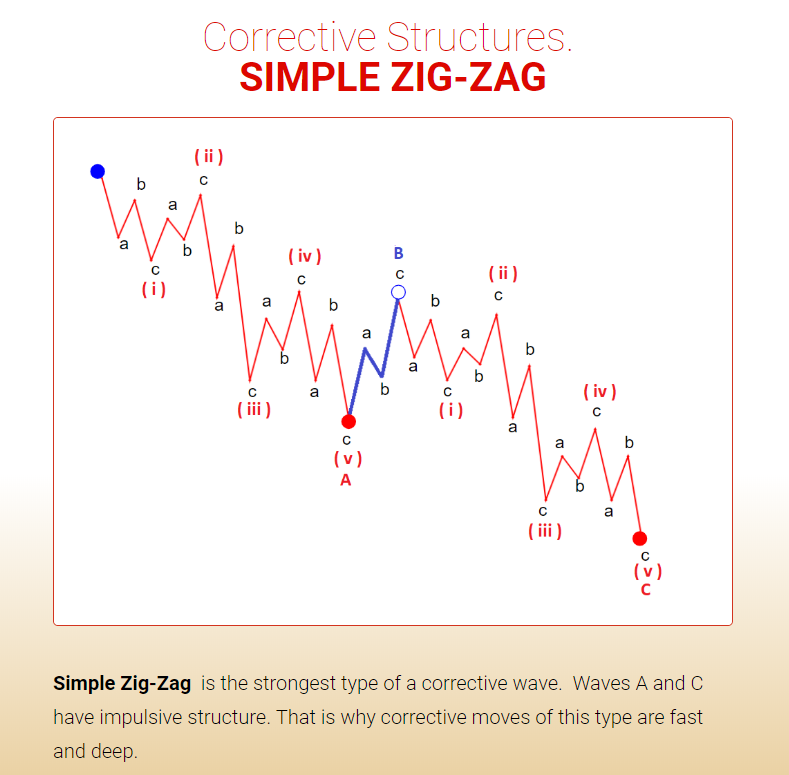
Now lets talk about a structure of that pullback in wave ( B ) down. We have two scenarios depending on teh structure that correction may choose to follow. The first structure is the Simple Zig-Zag. It’s subwaves A and C have impulsive structures and that makes that type of correction very deep.
Scenario 1. Simple Zig-Zag
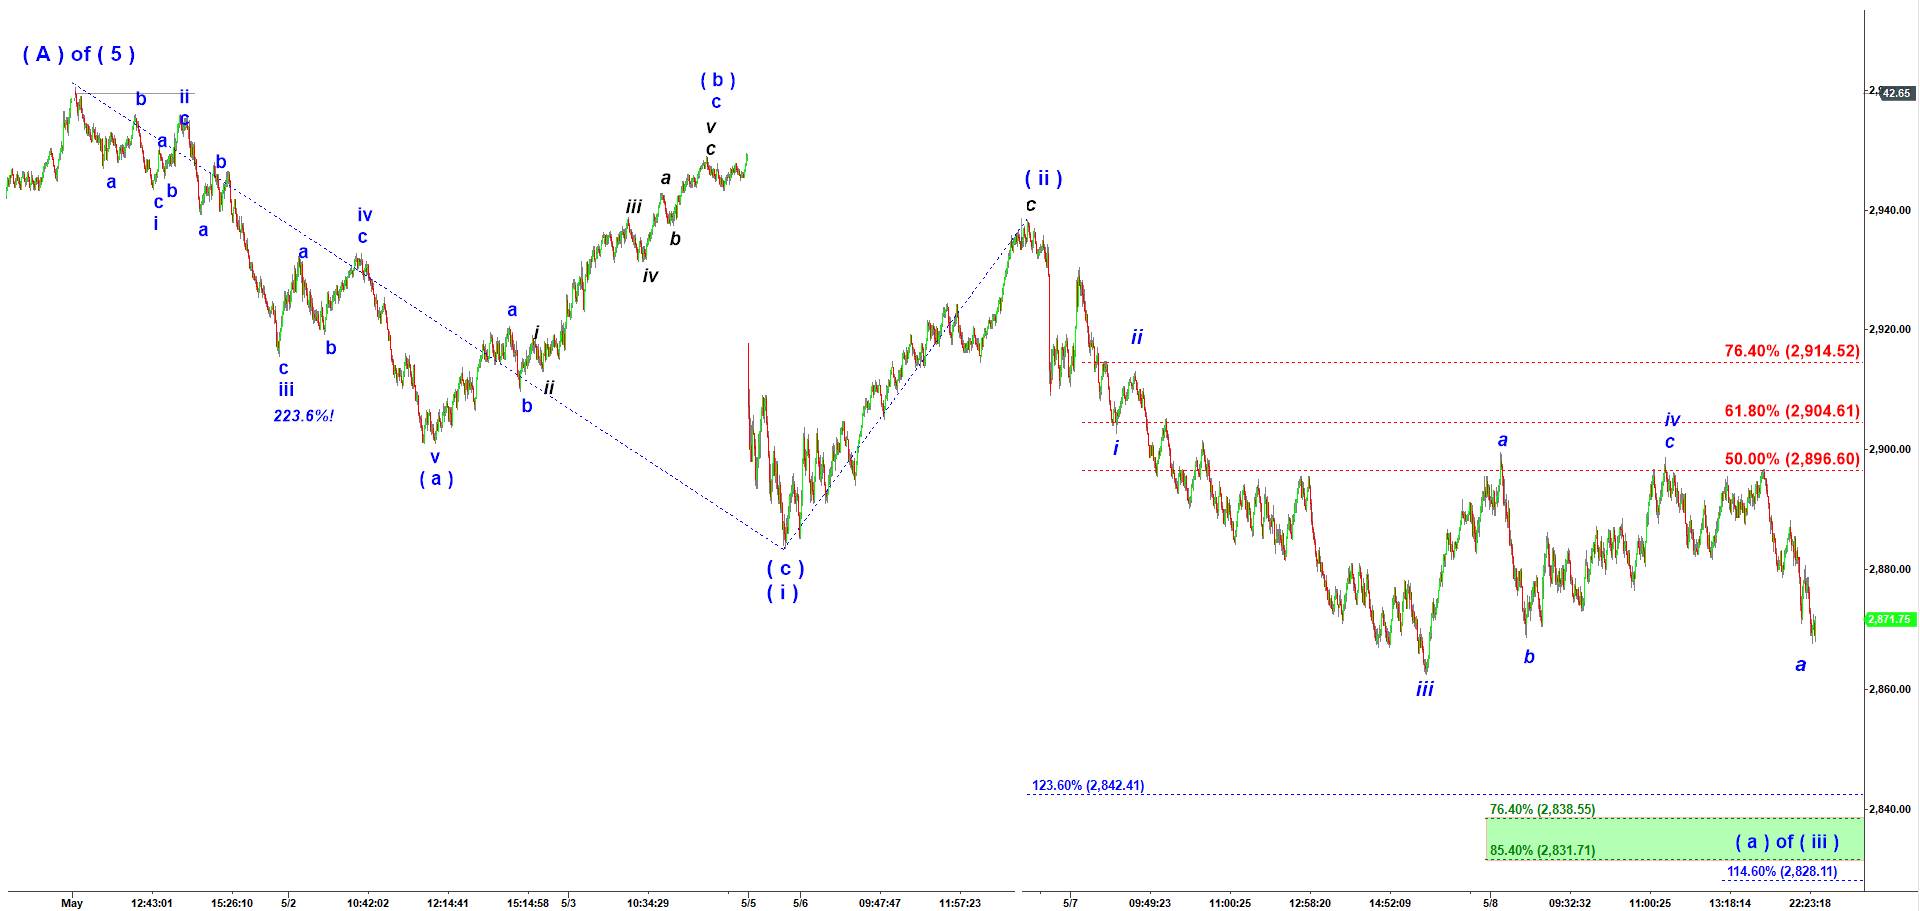
On the chart below you can see that under the Simple Zig-Zag structure price is about to complete wave ( a ) of ( iii ) down in 2,840 area. After a corrective wave ( b ) of ( iii ) up it should get the strongest part of the drop in wave ( c ) of ( iii ). That ( c ) of ( iii ) should be a drop by at least 120 points.
Scenario 1. "Very Bearish". ES-mini 3,000 tick bar chart counted as the Simple Zig-Zag
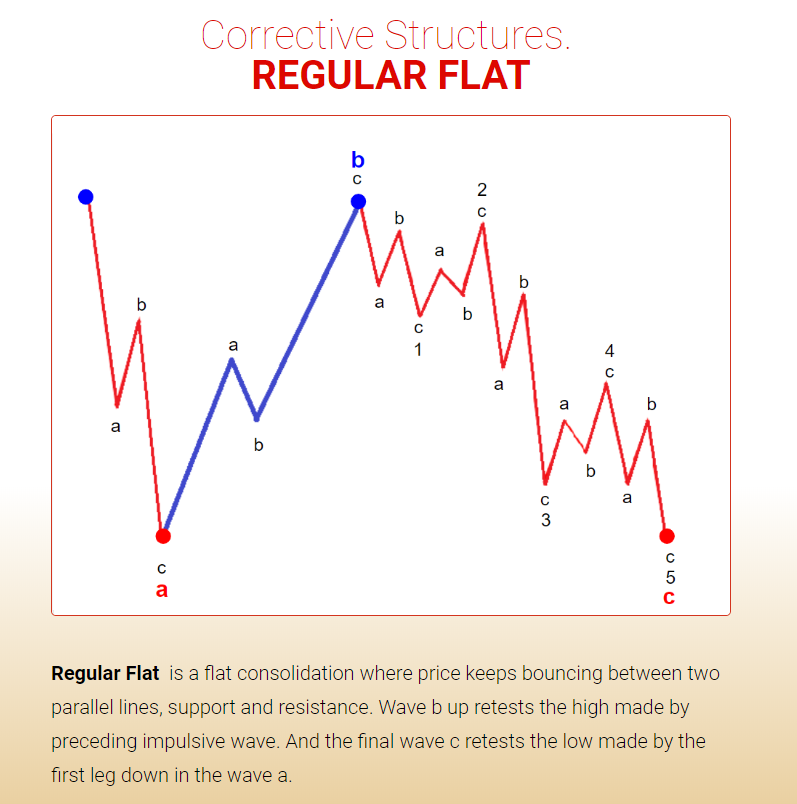
Scenario 2 is much less bearish. Under that scenario the price follows a Regular Flat structure.
Scenario 2. Regular Flat Structure
Please see below how this decline can be counted as the Regular Flat structure.
Scenario 2. "Less Bearish". ES-mini 3,000 tick bar chart counted as the Regular Flat
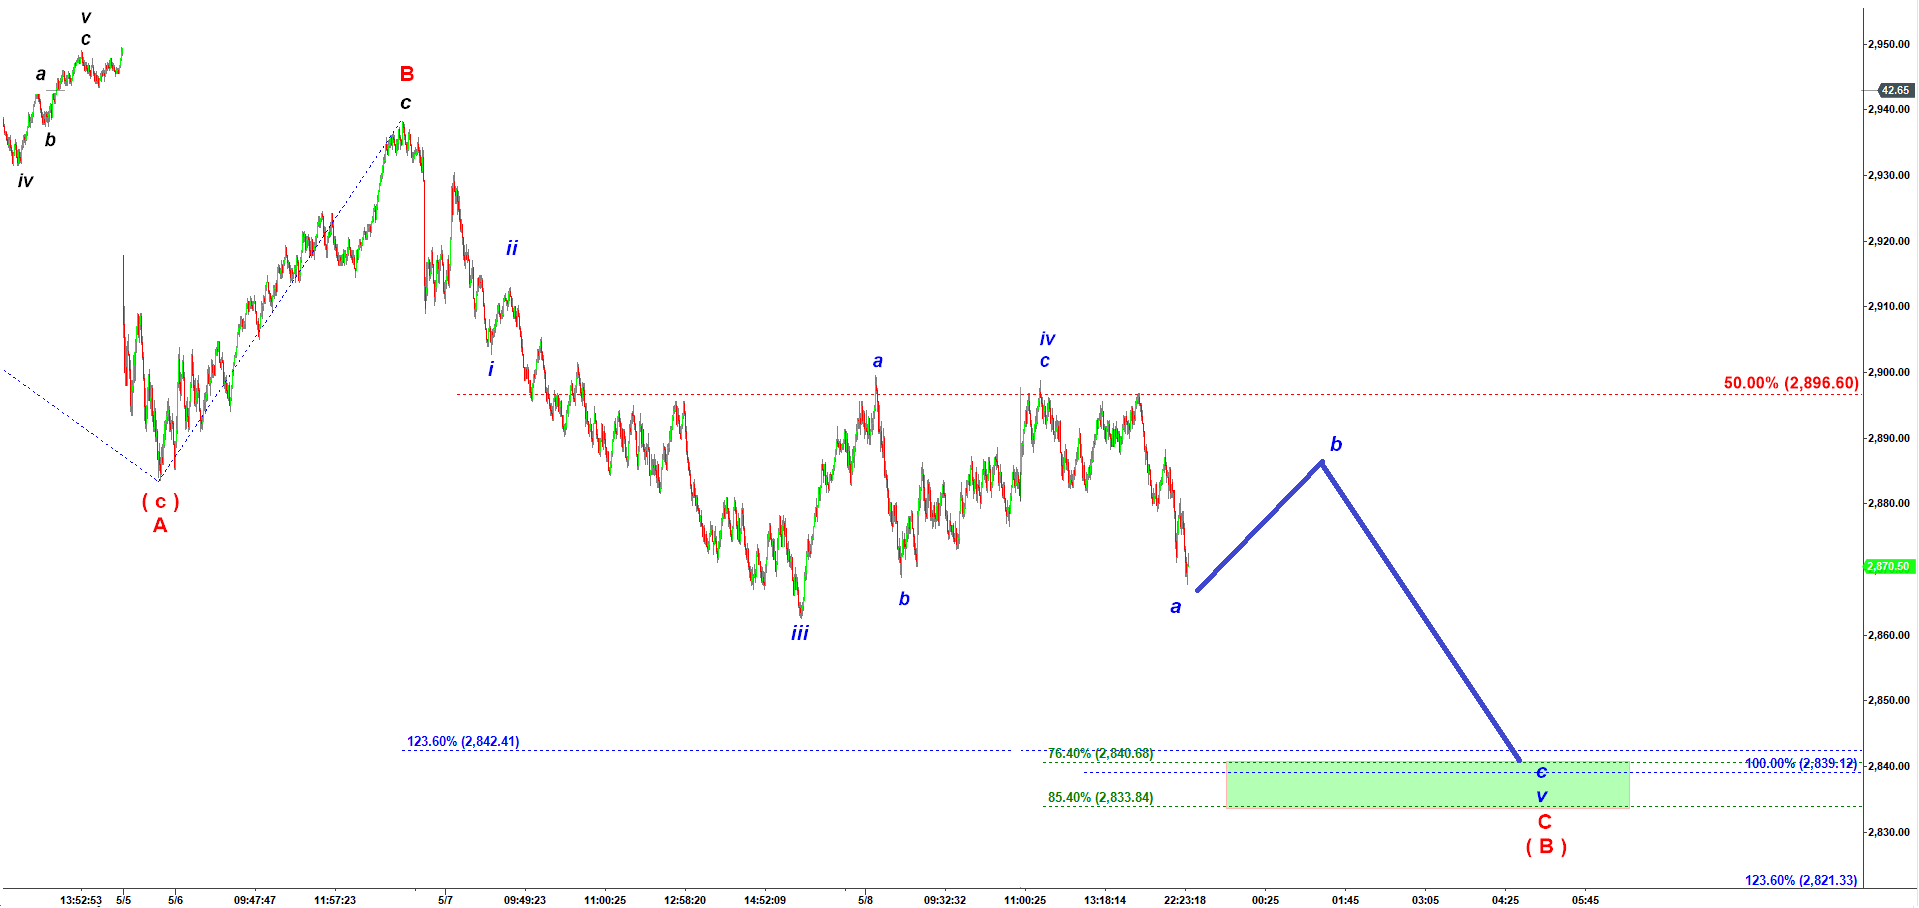
And this is how that current wave C down (red labels) may get completed in 2,840 neighborhood:
Scenario 2. "Less Bearish". ES-mini 3,000 tick bar chart counted as the Regular Flat
At this point it is impossible to say what scenario will be played out. Both scenarios require another drop to 2,840sh. And then we would be watching how strong will be a pullback off that low.