Skip to content
  • Home
  • US Market Updates
  • Indicators
    • Impulse Master
    • Cycle Trader
    • GANN Levels
    • Subscribe
  • Education
    • Beginners Video Course
    • Intermediate Video Course
      • Syllabus of the Course
    • Trading Like A Pro Video Course
    • Video Lesson of the Week
  • Chat Room
  • Pricing
  • FAQ
  • My Account
  • Login

Subscription: Access to Micro Counts of US indices

ES looks like it is gong to start a new week from a drop

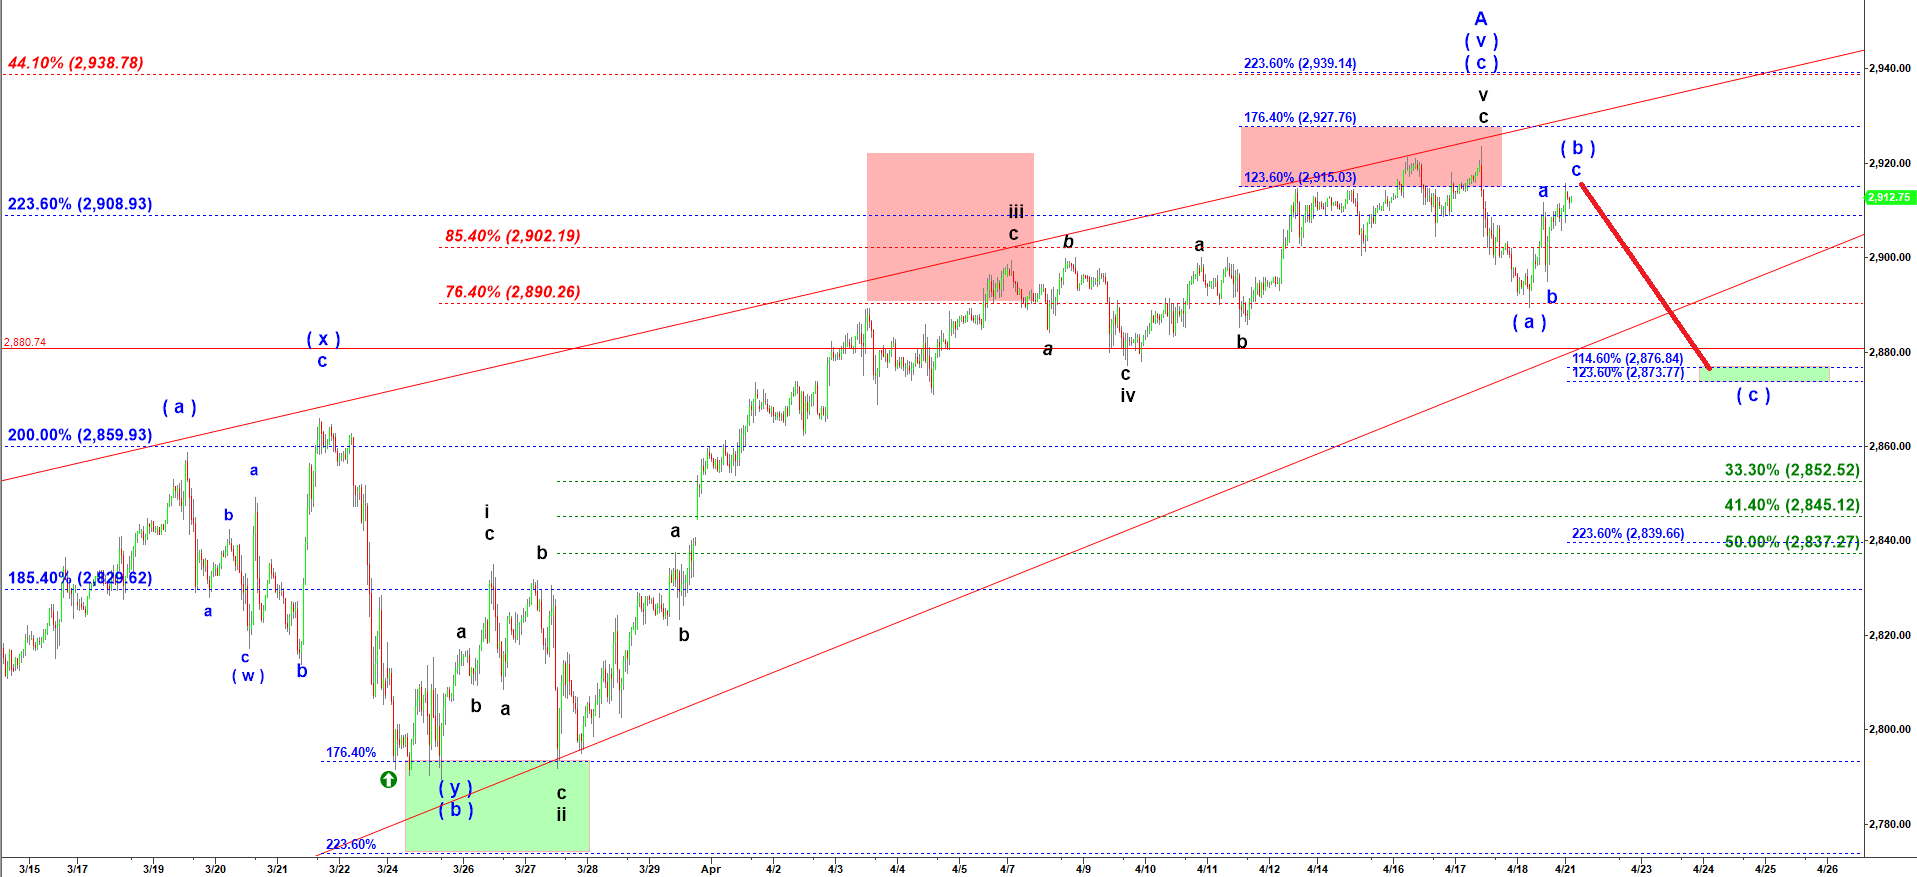
I count this move up off the 2,889.50 low made on Thursday as a corrective wave ( b ) up setting up a stage for a drop in wave ( c ) down. That current rally in wave c of ( b ) up may stretch to 2,917 – 2,922.50. Then we can get a drop in wave ( c ) down targeting 2,876-2,873.

This (a)-(b)-(c) down would complete the first leg down in the wave A of ( B ) down. Then we may get another corrective pullback up in wave B up that would be a good setup for a short in expectation of the final bigger decline in wave C down.

ES Mini - 45 min chart updated at 8:30 PM on 4/21/2019

Sunday 8:33 PM

Previous posts:

No posts found.
© 2025 CastAway Trader • Built with GeneratePress