• Home
  • US Market Updates
  • Education
    • Beginners Video Course
    • Intermediate Video Course
      • Syllabus of the Course
    • Trading Like A Pro Video Course
    • Video Lesson of the Week
  • Blog
  • Chat Room
  • Pricing
  • FAQ
Menu
  • Home
  • US Market Updates
  • Education
    • Beginners Video Course
    • Intermediate Video Course
      • Syllabus of the Course
    • Trading Like A Pro Video Course
    • Video Lesson of the Week
  • Blog
  • Chat Room
  • Pricing
  • FAQ

ES-mini - the rally looks corrective

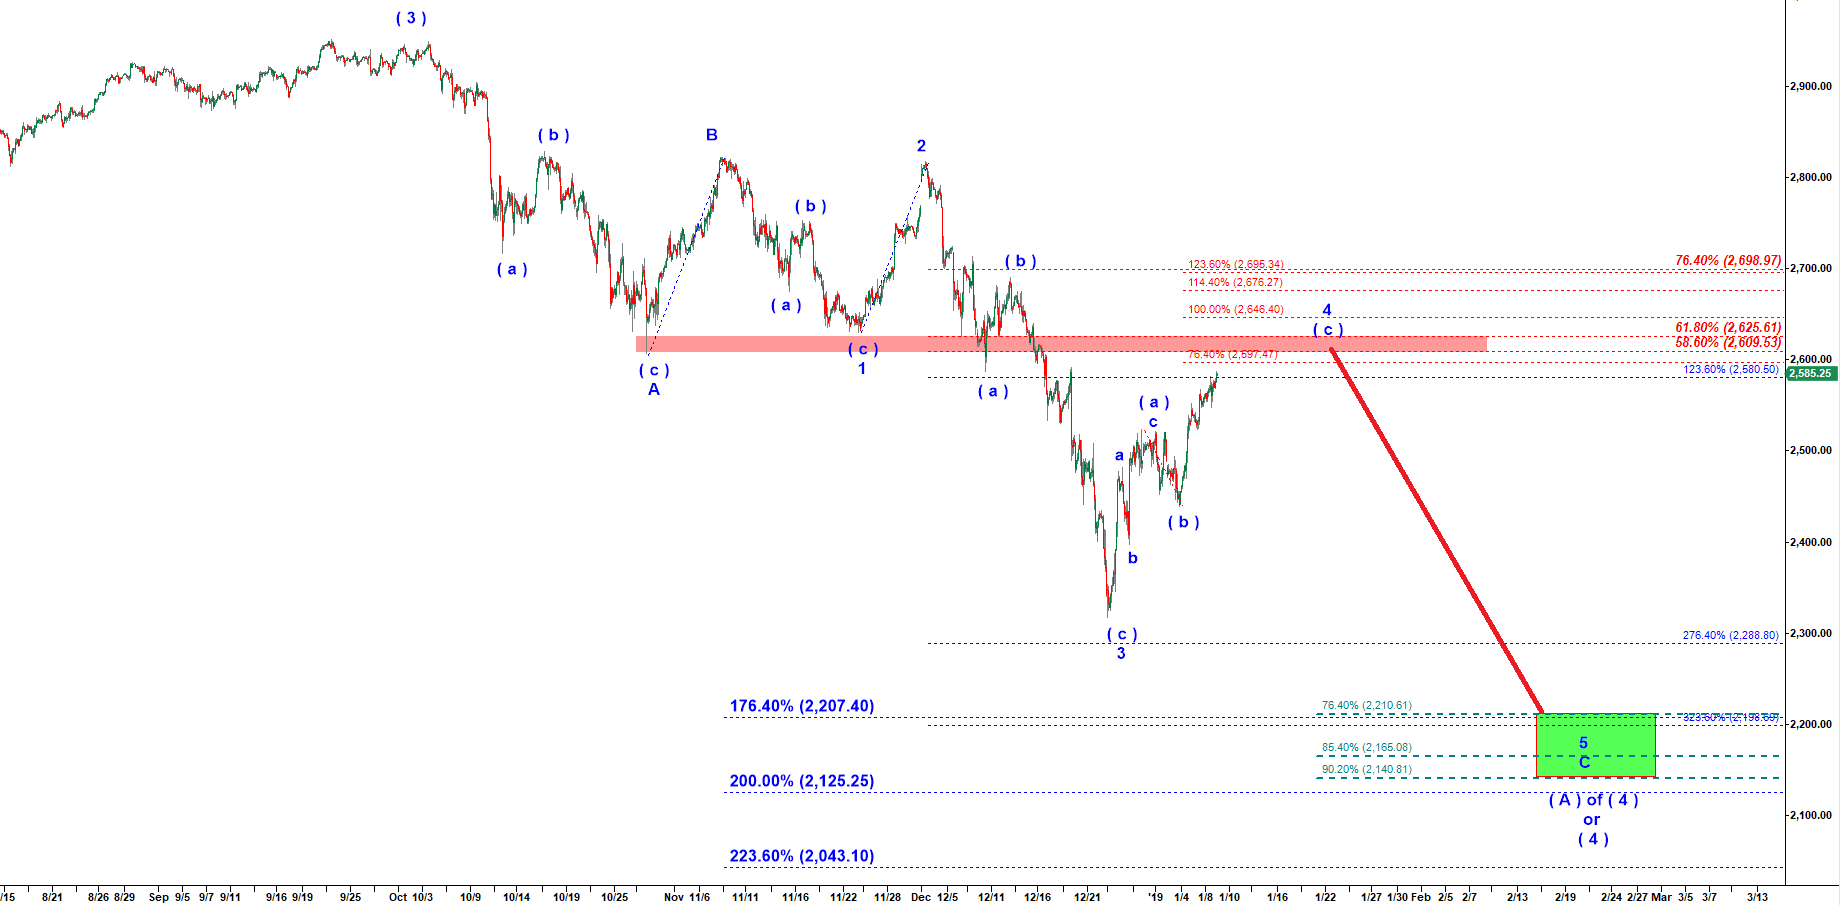
The structure of the decline off the September 2018 top looks like a corrective A-B-C down pattern. The wave C, the final leg of the correction, shall be subdivided into five subwaves. I count the low made on 25 December 2018 as the bottom of the wave ( iii ) of C. And I count the rally off that low as a corrective (a)-(b)-(c) of wave ( iv ) up. That wave ( iv ) up may top at 2,597-2,610-2,625. Once it tops out we should expect another decline to a new lower low.

ES-mini - 120 min chart updated on 8 January 2019

Start to learn how to predict the next market move today!
Check out my latest updates
Tags
$ES $SPX a-b-c- up pullback a-b-c up Bearish reversal Bear Market Rally Bitcoin Bottoming Breakdown breakout Bullish Wedge Crude Oil Daily Double Three DXY ES Expanded Flat Expanding Triangle failed breakdown failed breakout Green Box Head and Shoulders i down - ii up setup Inverse Head and Shoulders i up - ii down setup Macro micro Month Opening Range NQ one more high one more higher high Red Box RTY Running Flat S&P short setup SPX topping toppying trading setup triangle Triple Three weekend Weekly YM
Read my Blog

  • My Account
  • Login
Hestia | Developed by ThemeIsle