ES-mini - stretched higher than I expected
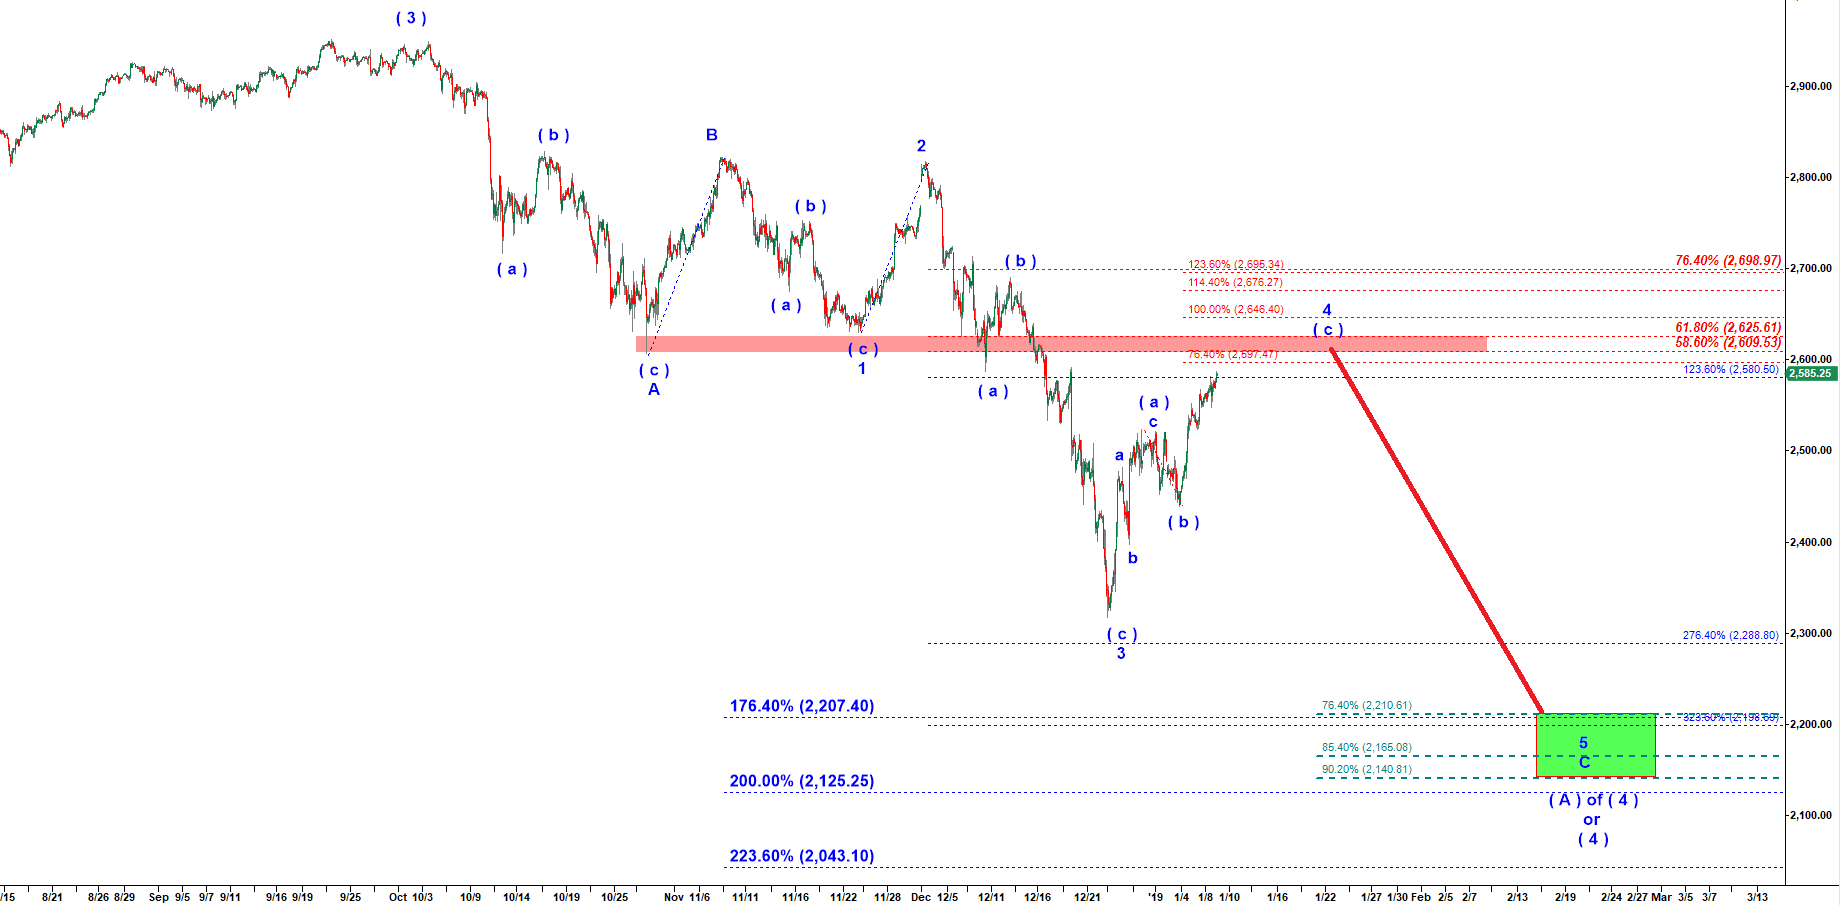
In my last update on ES posted on 8 January 2019 I predicted that ES would top at 2,597-2,610-2,625. I counted that rally off December 2018 low as a corrective (a)-(b)-(c) of the wave ( iv ) up. That count implies another drop to a new lower low in wave ( v ) down (see the old chart below ).
ES-mini - 120 min chart updated on 8 January 2019
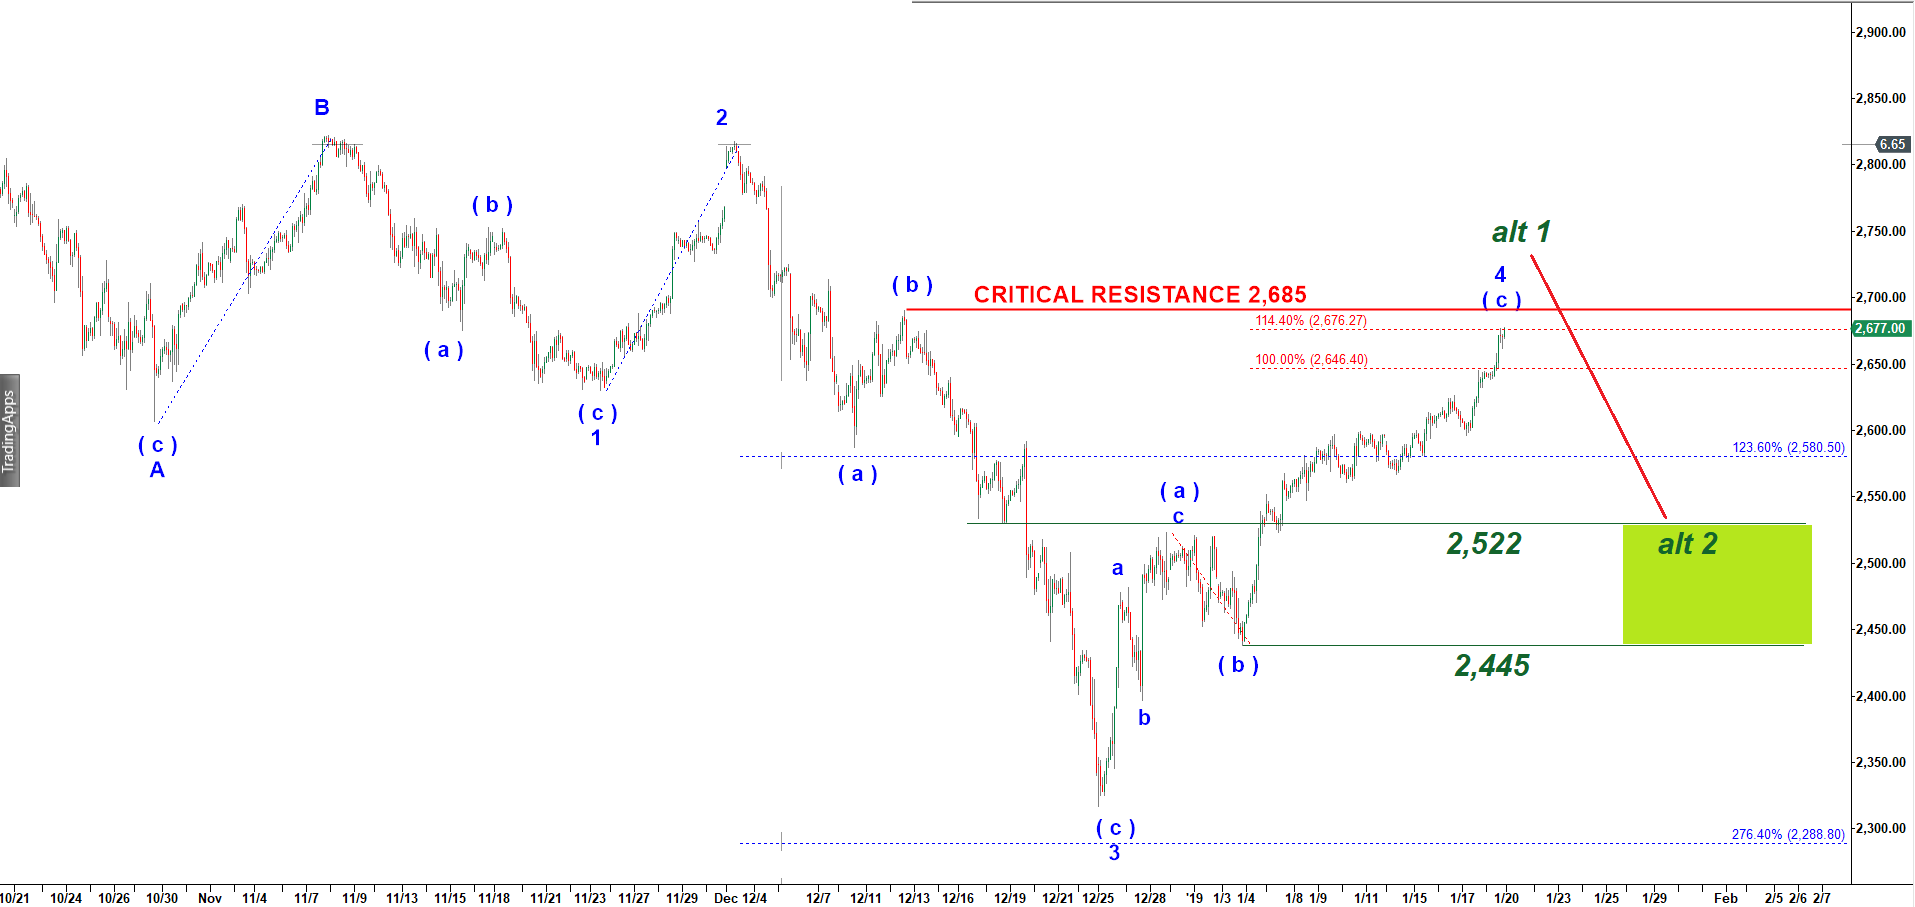
However, ES reached to 2,677 this Friday which is 114.4% extension of wave ( a ) off the low. That could be a nice topping area because it stopped one step away from the critical resistance at 2,685. As long as we stay under that level the bearish count is alive.
Let’s discuss what would be the consequence of potential violation of that resistance. That would mean invalidation of the bearish count. Meaning that probability of getting another lower lower low under the December 2018 bottom would become very low.
Under that alternative bullish scenario (see the green count on the chart below) that (a)-(b)-(c) move off the low would be wave ( i ) up of a new rally or wave A of a larger corrective wave ( B ) up of ( 4 ) down. Under that scenario ES may keep grinding up to 2,700 which is 123.6% extension of the wave ( a ) up. That would violate that critical resistance level at 2,685 making bears panic and finally run their stops. But even under that scenario that spike over the resistance would be short lived. We should later see a pullback to the green target zone drawn on the chart below.
ES-mini - 120 min chart updated on 19 January 2019