Subscription: Access to Micro Counts of US indices
Nasdaq Composite - let's look at a big picture
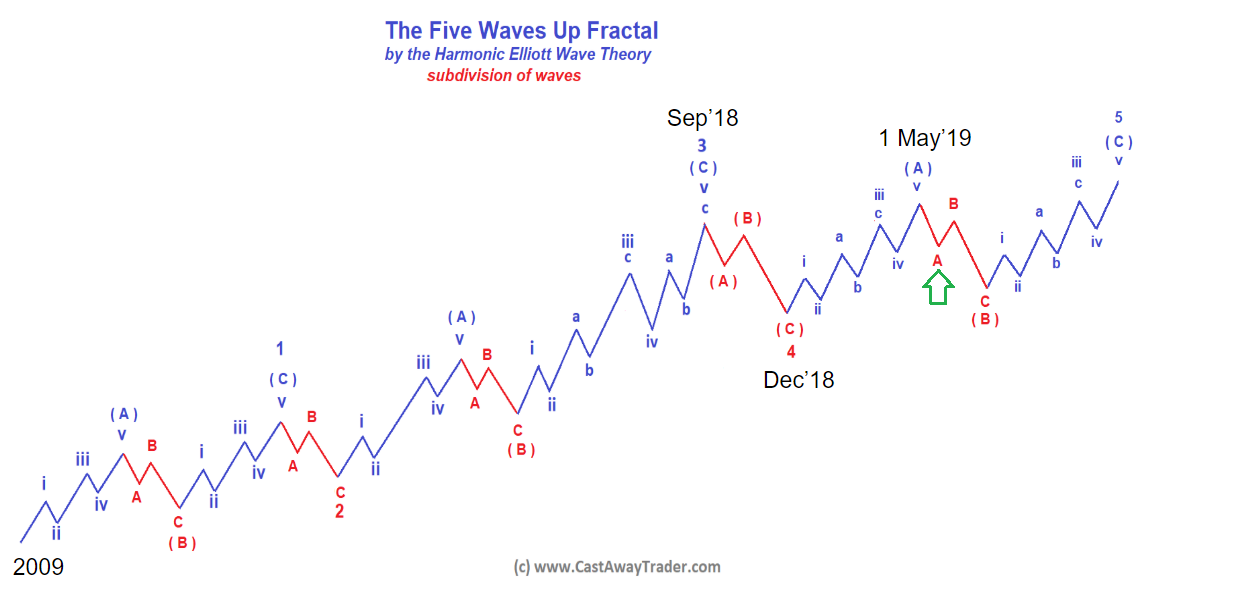
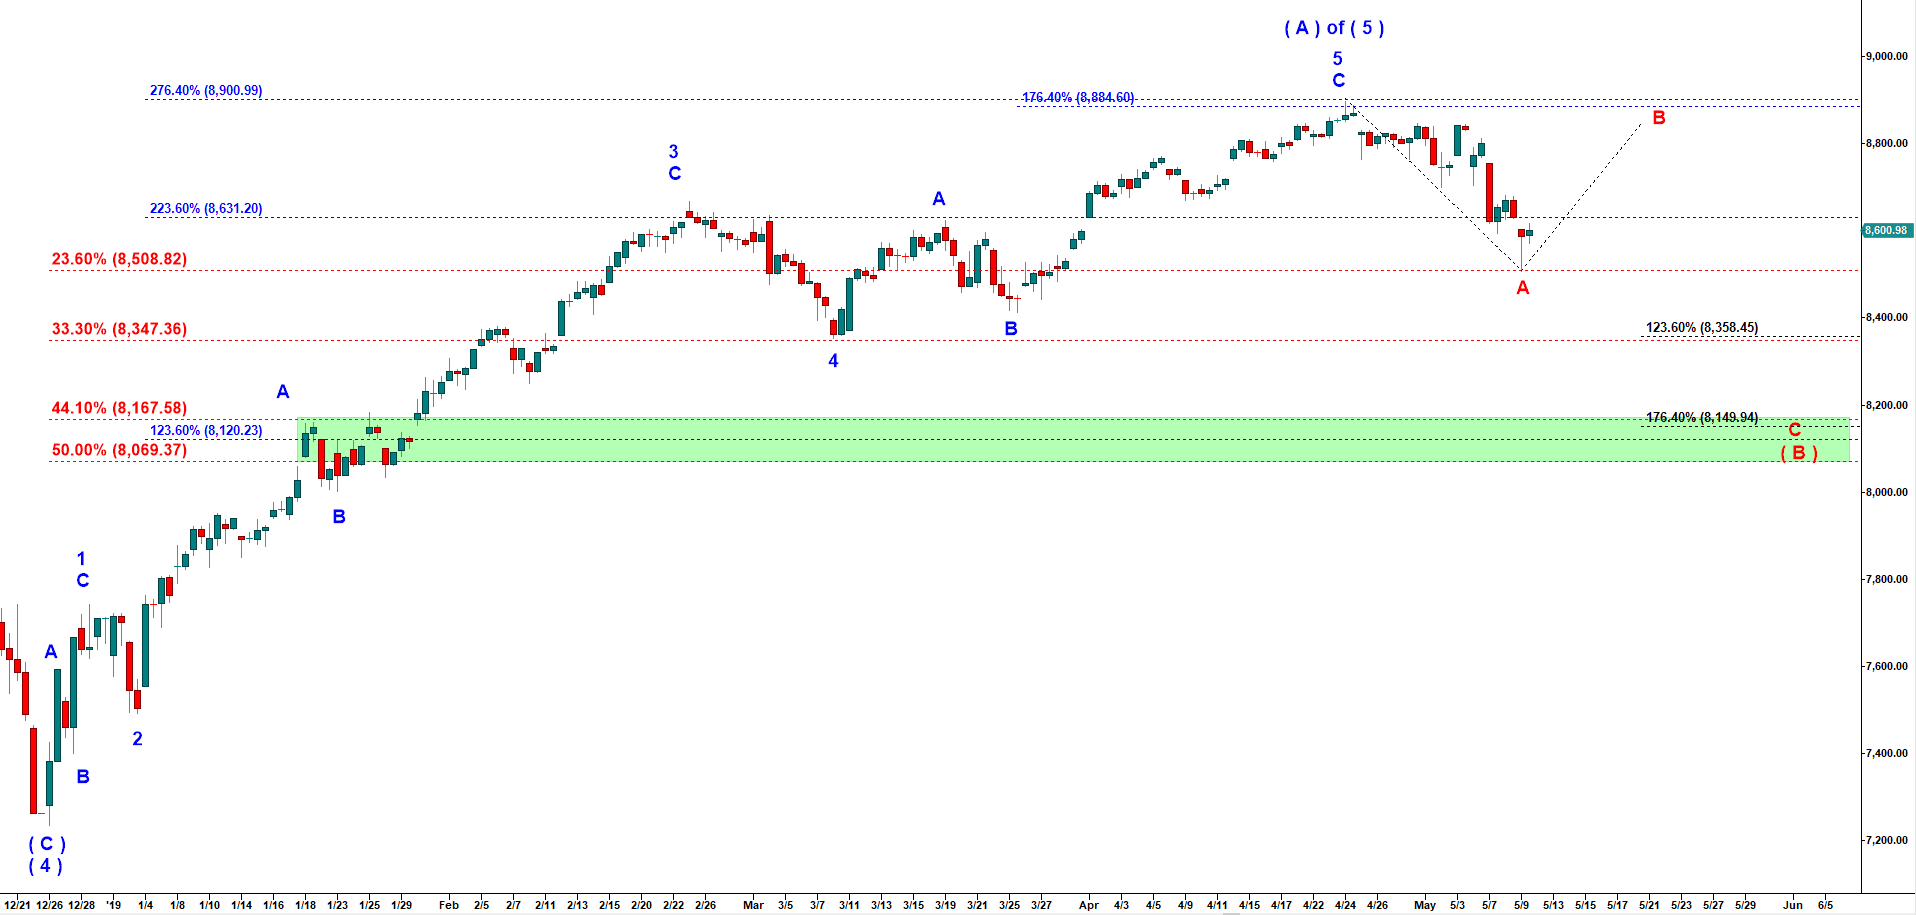
Nasdaq Composite has been following the Five Wave Up fractal since 2009. It topped in the wave 3 up last September and then dropped in the wave 4 down into December lows. Then it topped in wave ( A ) of 5 on 24 April 2019. Since then it has been in a corrective wave ( B ) down structured as A-B-C.
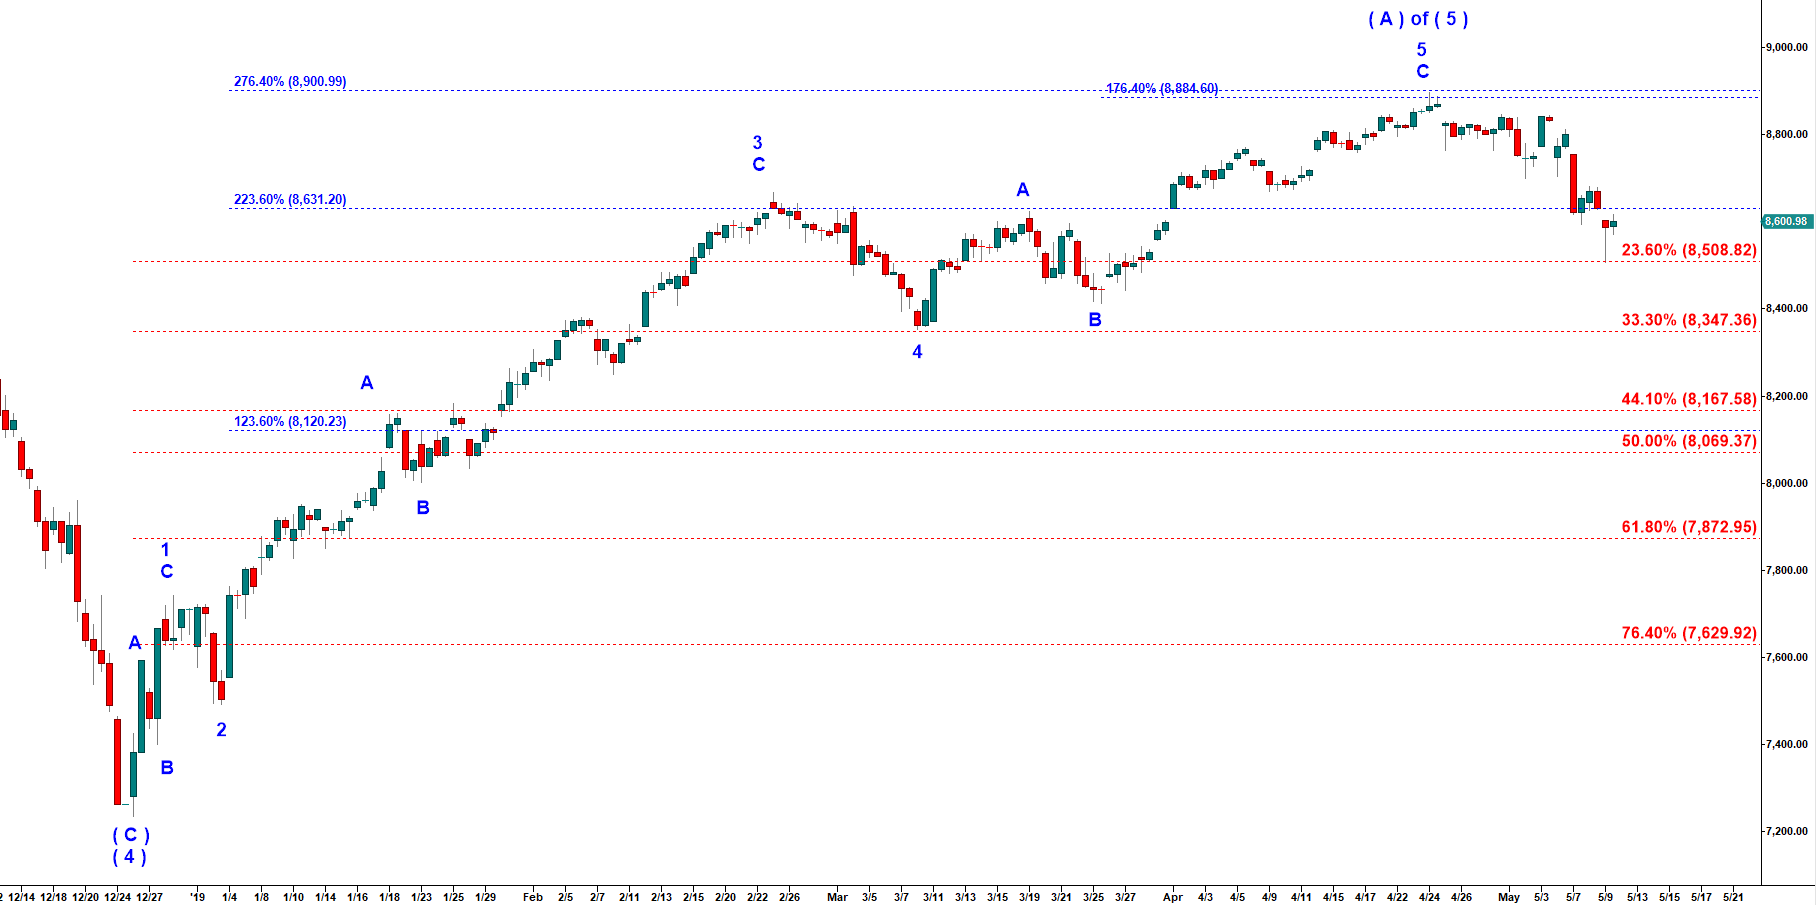
Below you can see a nicely completed Five Wave structure of the rally in the wave ( A ) of 5. And as you can see, it has tagged an important 23.6% retracement fib this morning.
Nasdaq Composite 120 min chart updated on 5/9/2019
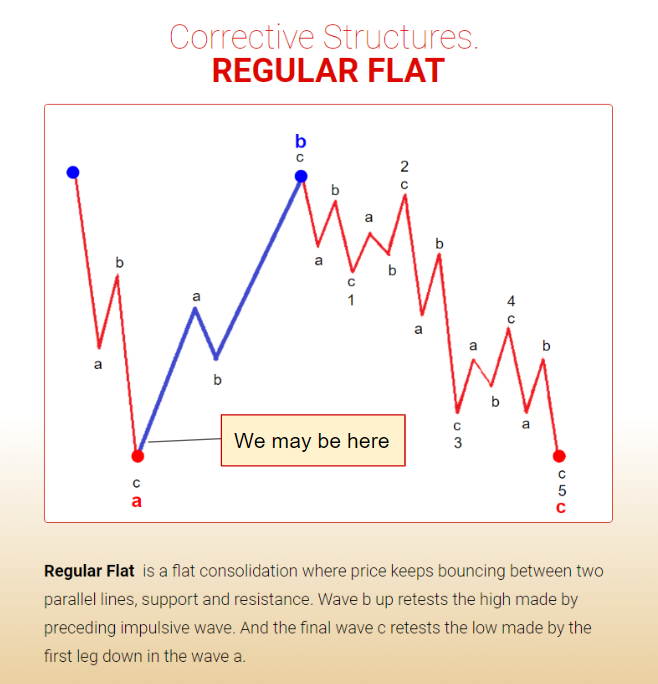
Below you may see a structure of that corrective wave ( B ) down. The first leg down in wave A is itself subdivided into a-b-c.
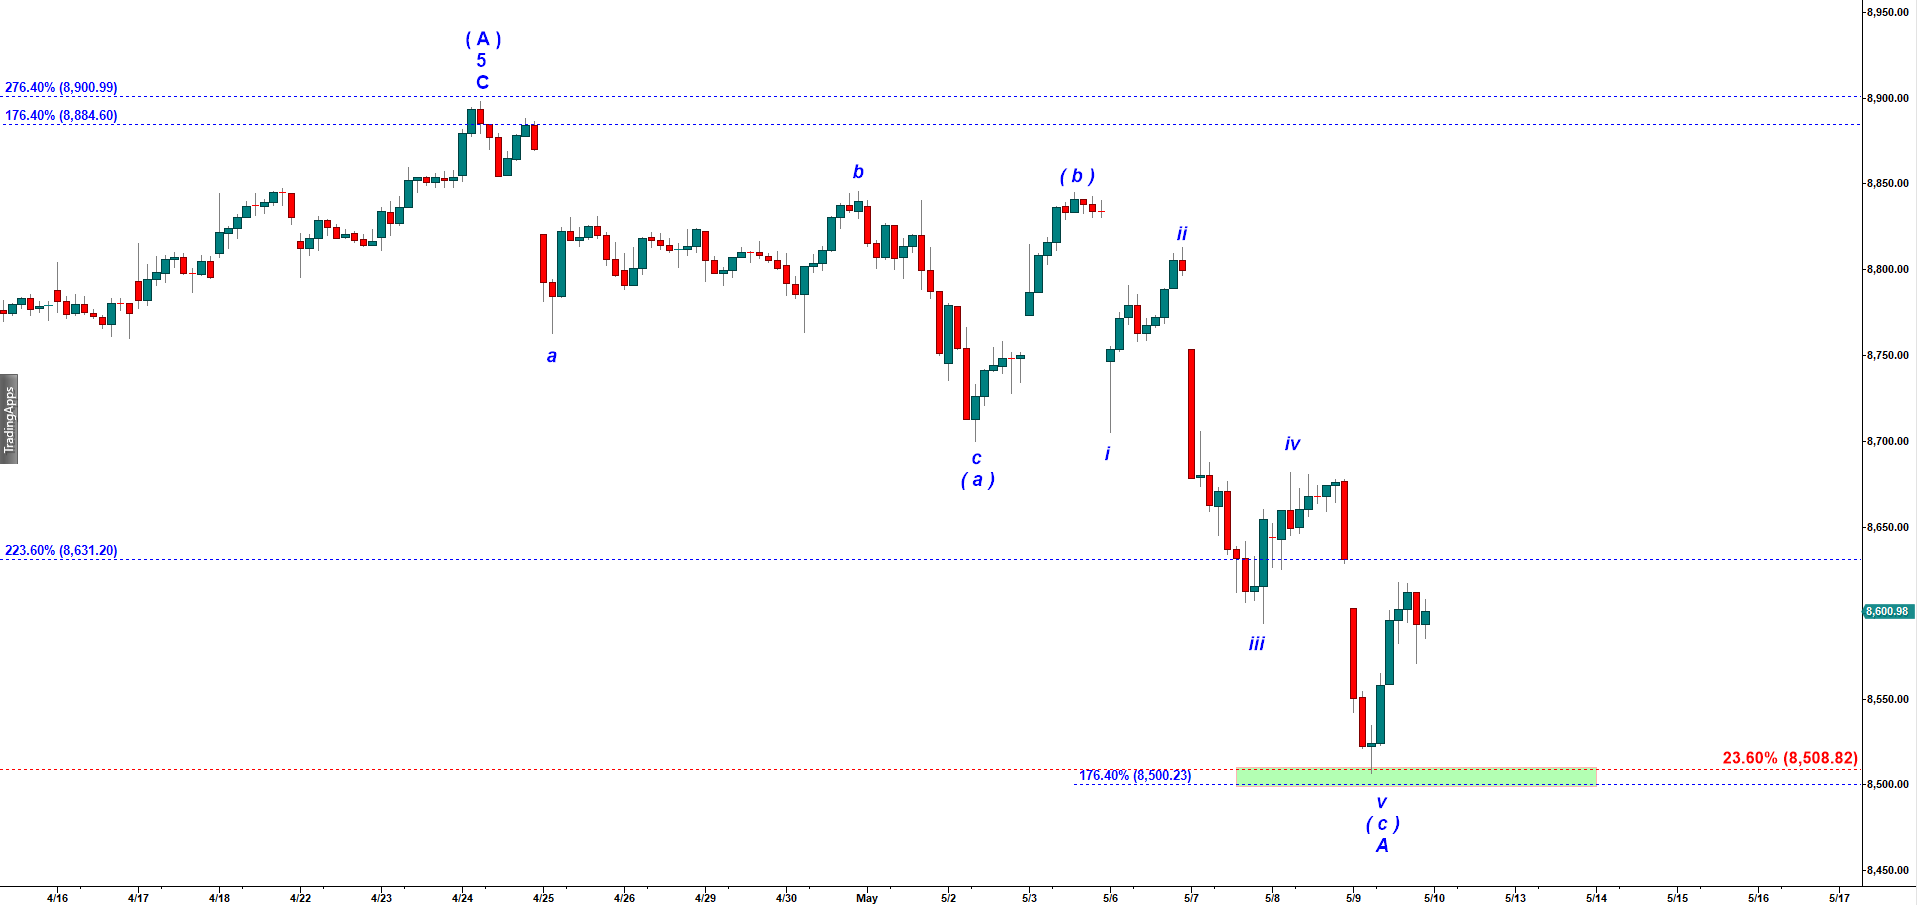
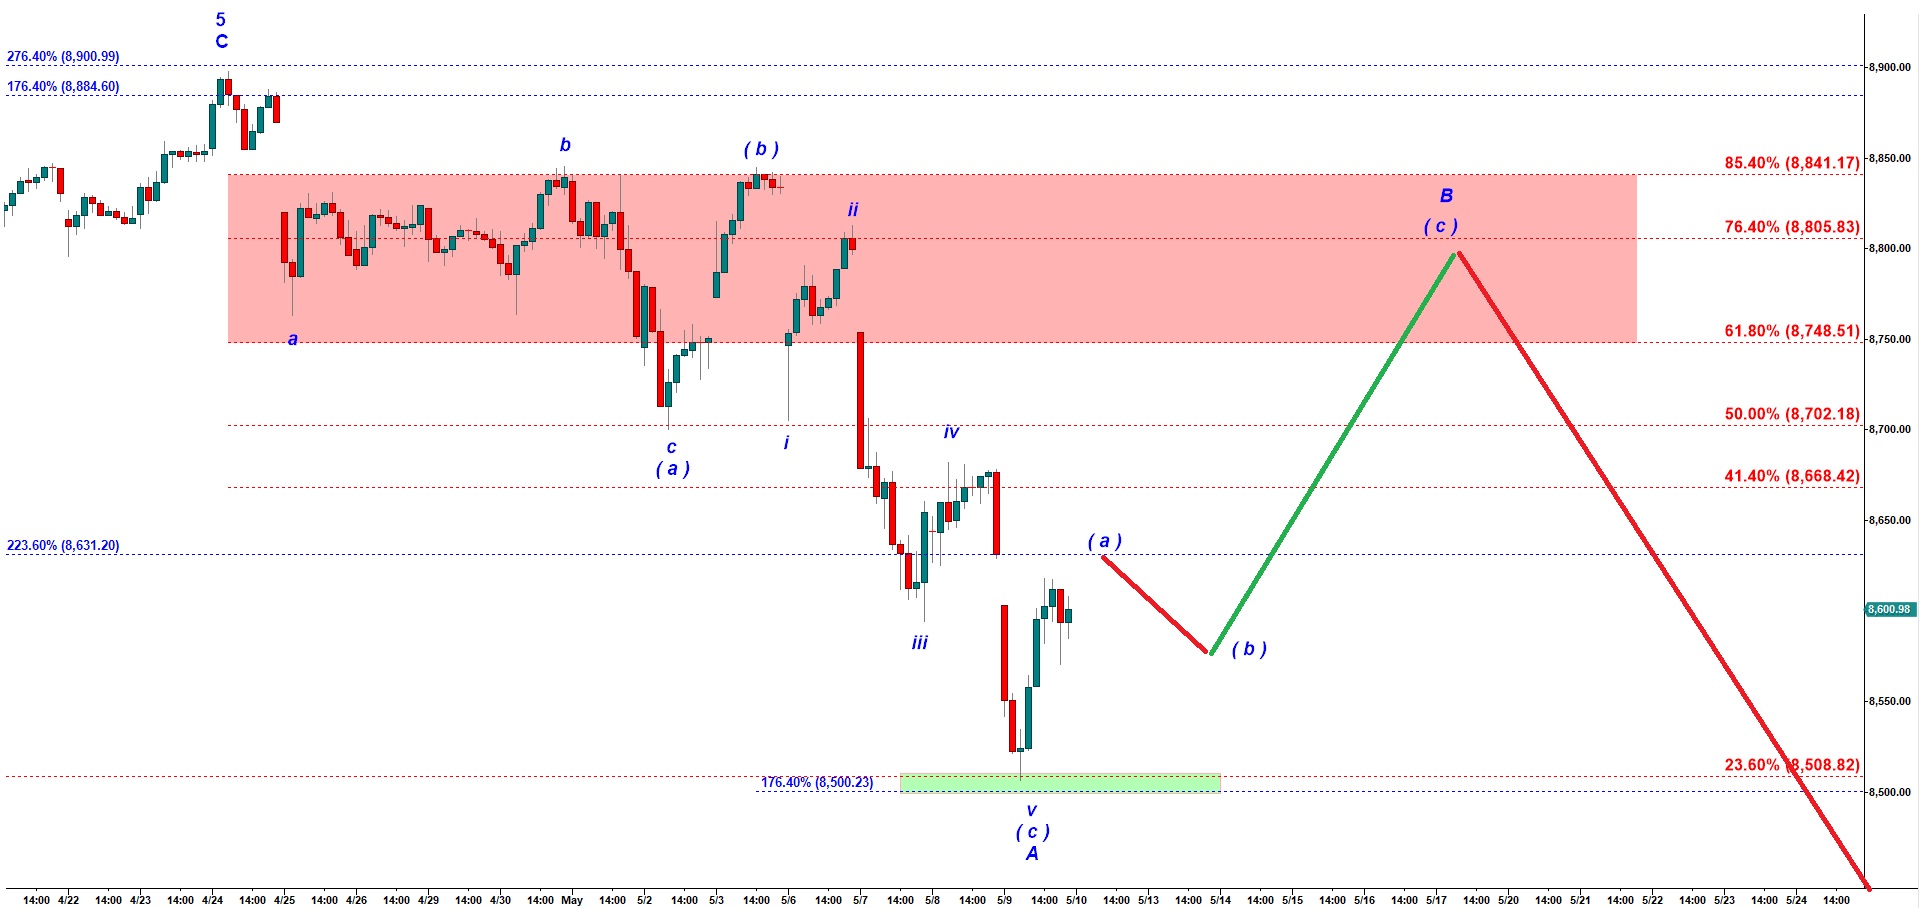
Below you can see an actual chart of Nasdaq and that (a)-(b)-(c) structure of the first leg down in wave A of ( B ). Note that wave ( c ) hit 176.4% extension of the wave ( a ) down.
Nasdaq Composite 45 min chart updated on 5/9/2019
On the chart below you can see a possible path for that corrective wave B up. That wave B up has to be subdivided into (a)-(b)-(c) and wave ( c ) may push price all the way up to the recent low. Here we should track retracement fibs of that first leg down in wave A down.
Nasdaq Composite 45 min chart updated on 5/9/2019
Now let’s come back to 120 min chart to see what will be potential bottoming zone for the final leg down in wave C of ( B ) down.
First we should add retracement ratios to the whole rally started in December 2018 and topped on 24th of April. We are interested in three levels, 33.3%, 44.1% and 50% (find the fibs on the left part of the chart). In addition, we know after a completion of the five wave up fractal normally price drops back to the bottom of wave 4 down of a smaller degree (around 8,350).
Nasdaq Composite 120 min chart updated on 5/9/2019